Search
CSAT Reports help you track customer satisfaction performance across agents, teams, and channels. You can monitor CSAT scores, response trends, and detailed breakdowns from a single dashboard.
This article explains how to access and understand the CSAT Reports page.
CSAT Reports help you:
Users with access to Reports can view CSAT analytics.
Permissions may vary based on your role configuration.
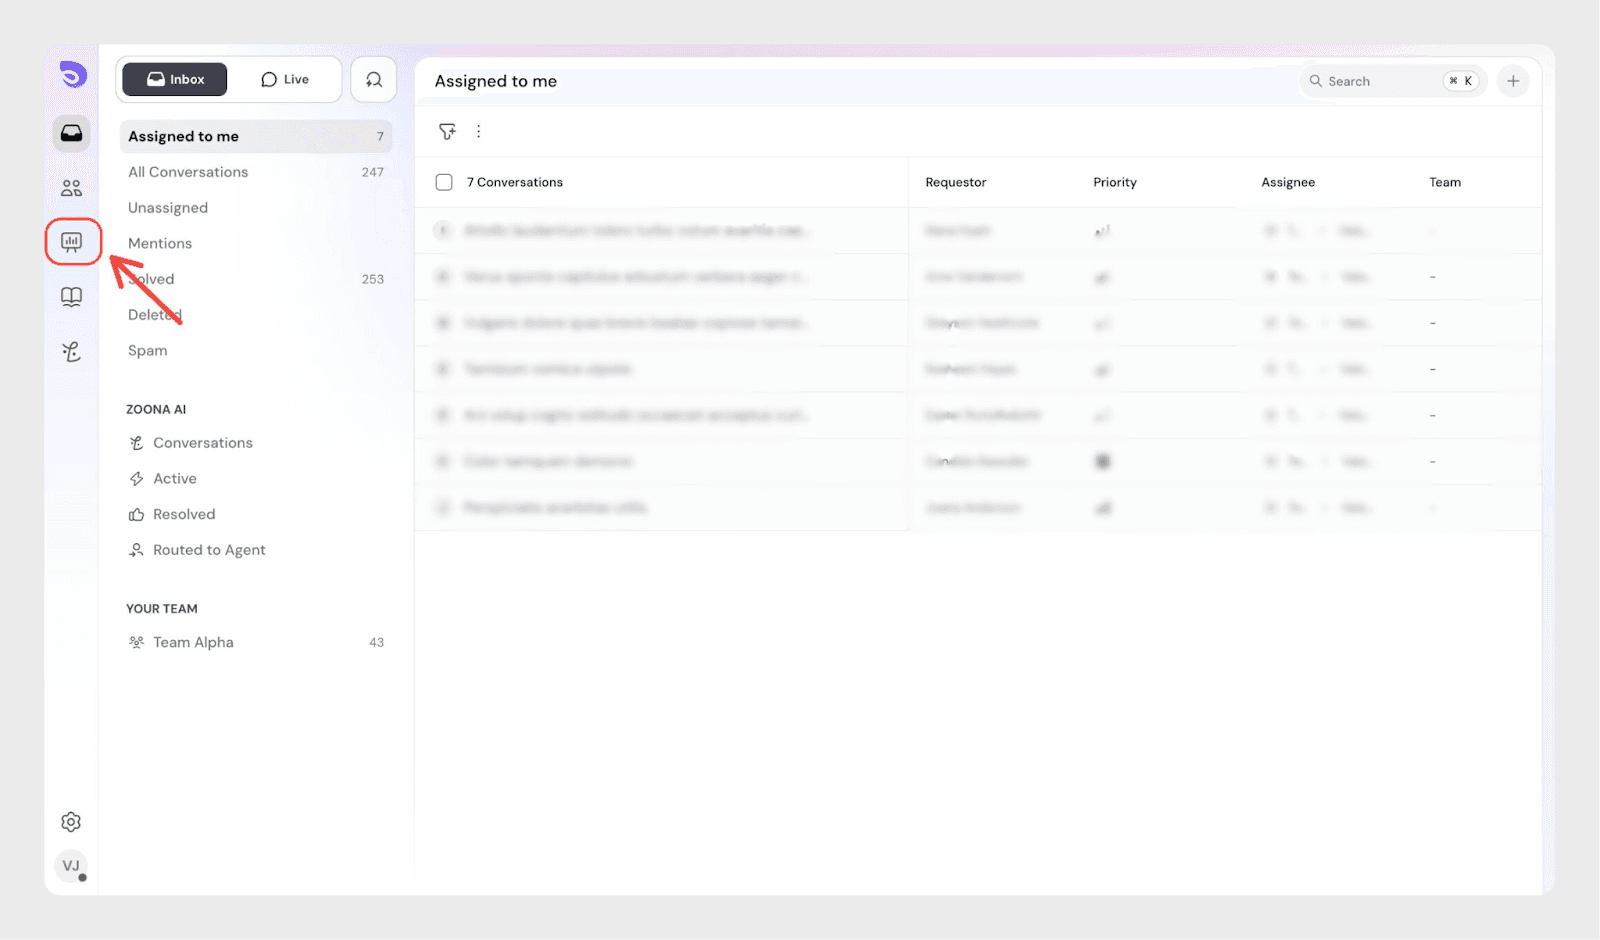
To access CSAT Reports:
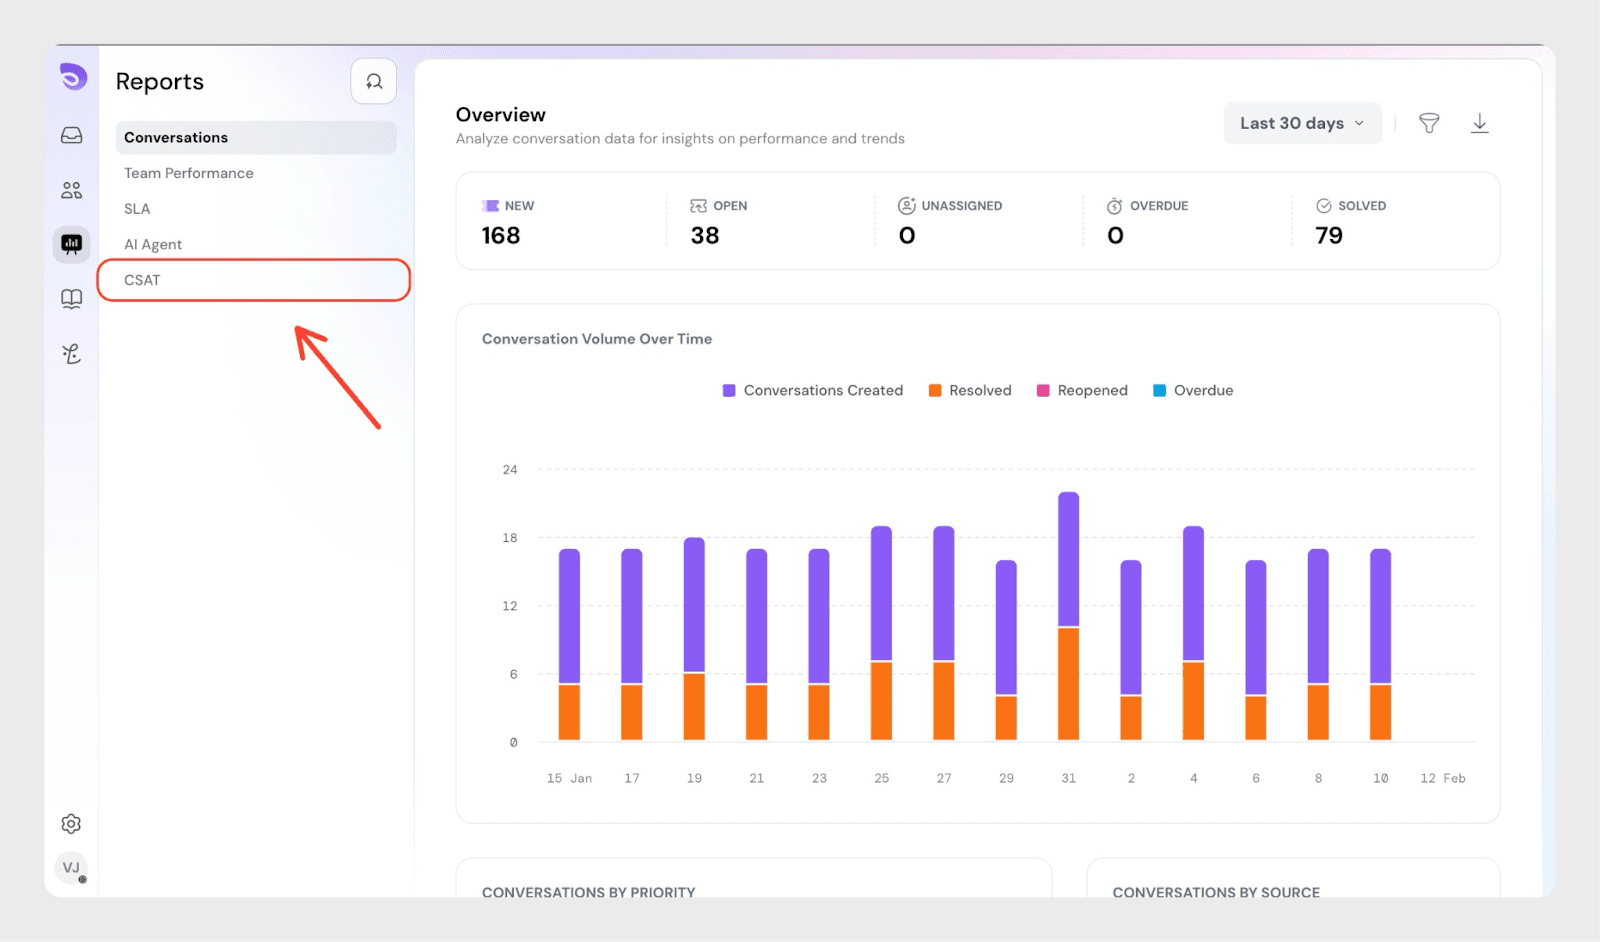
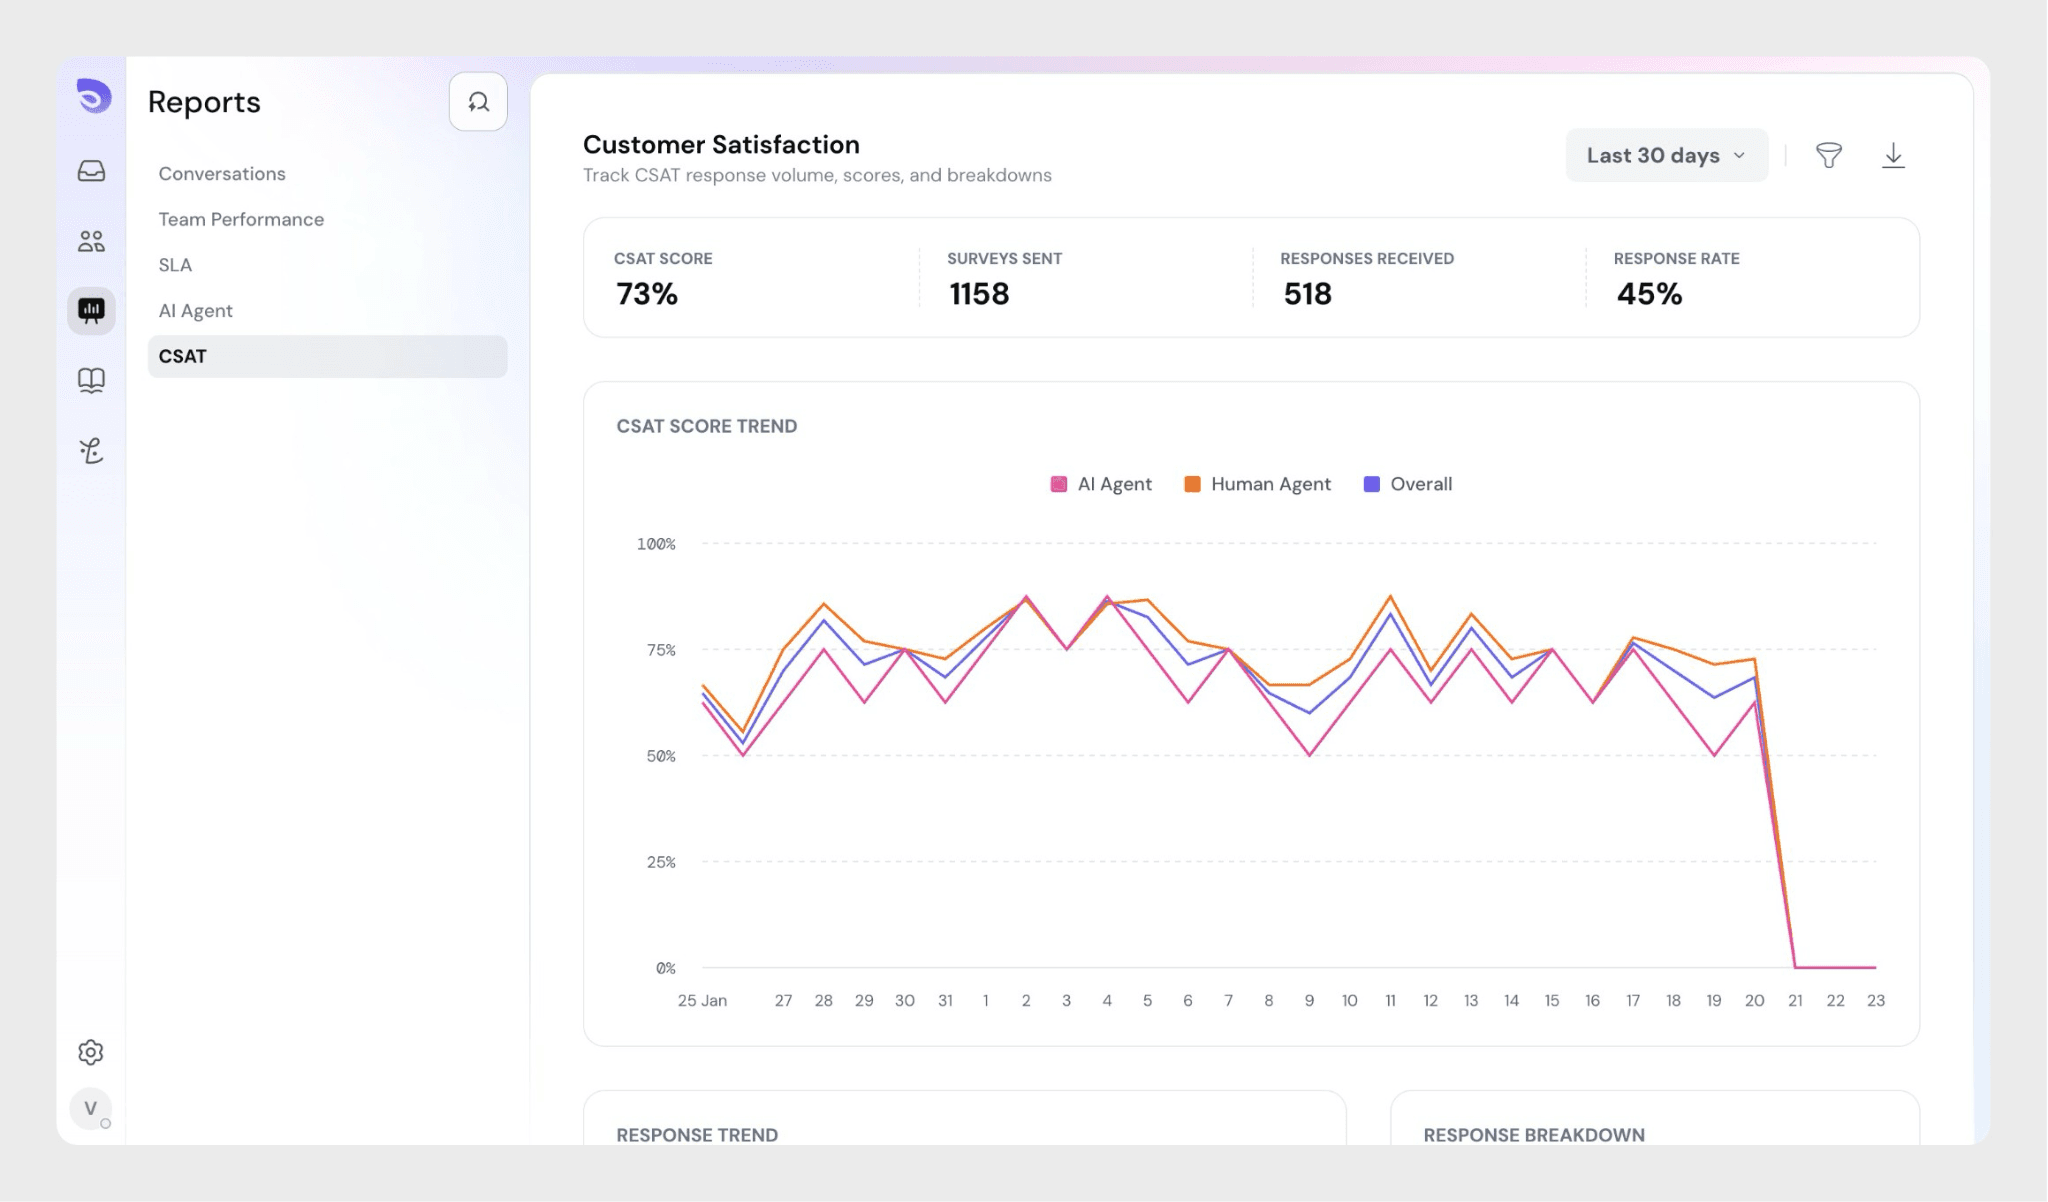
This opens the Customer Satisfaction dashboard.
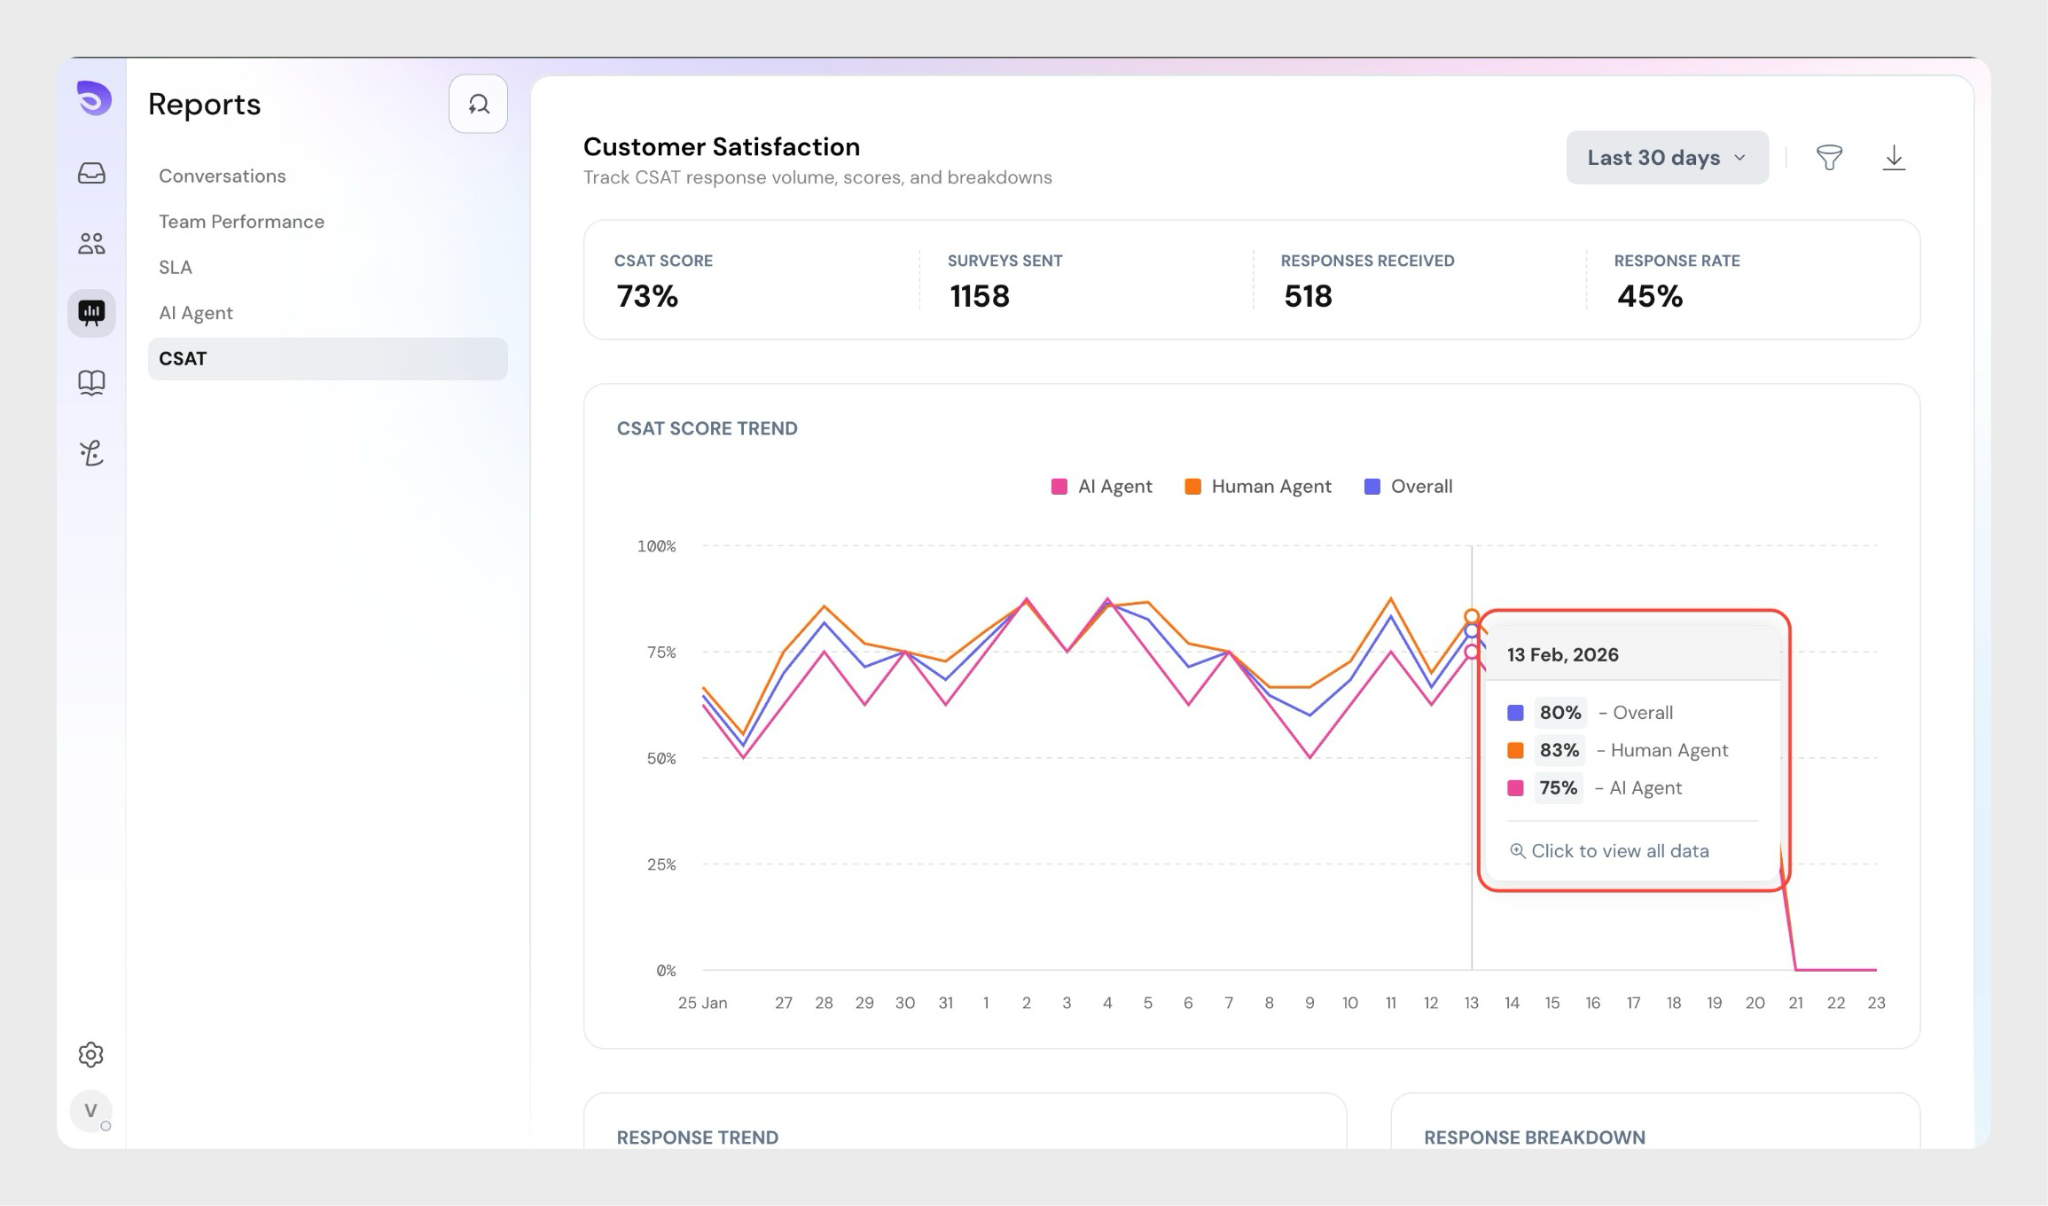
At the top of the page, you’ll see key CSAT metrics for the selected time period:
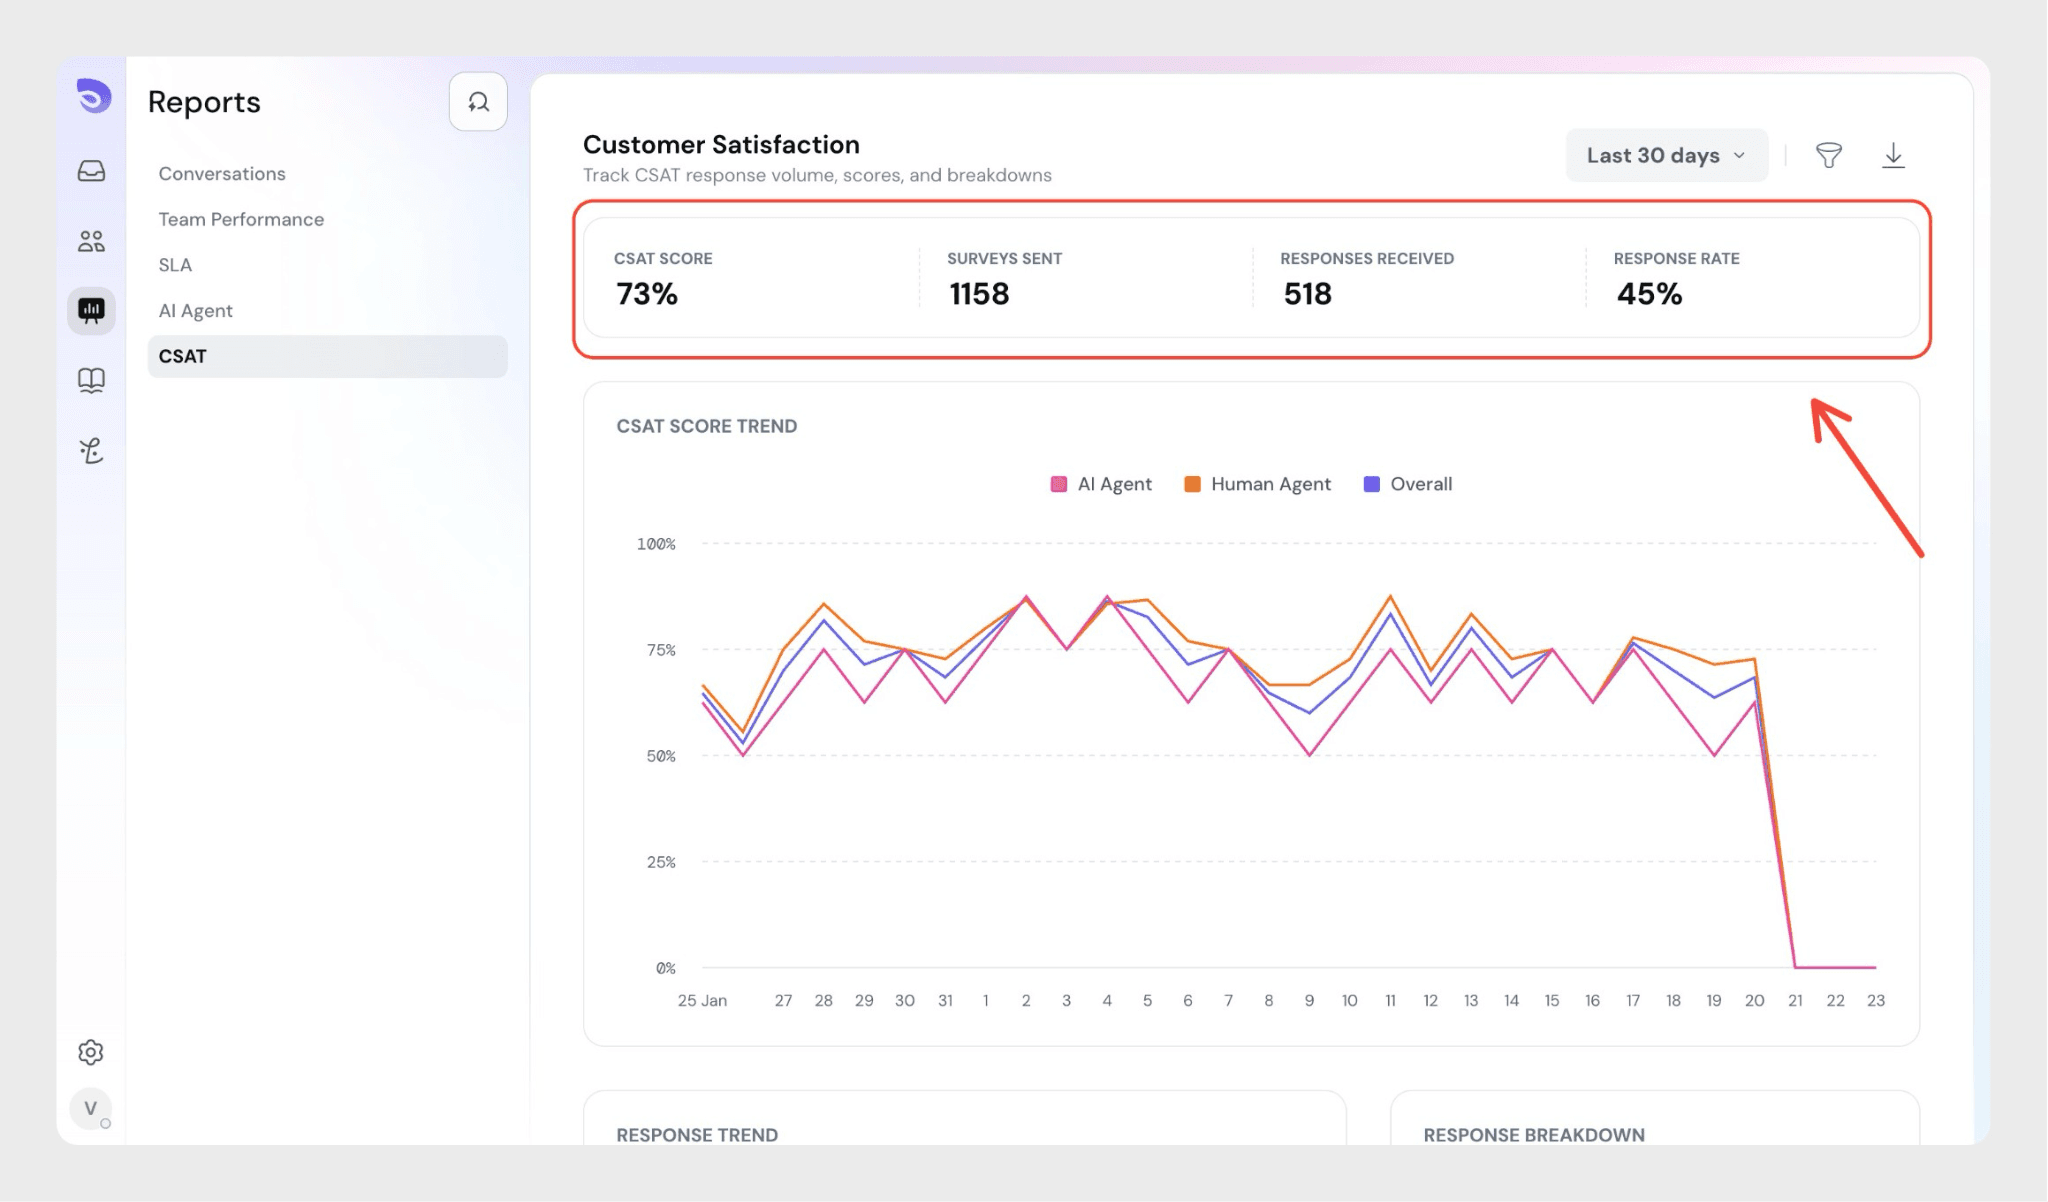
Use the date filter in the top right (for example, Last 30 days) to adjust the reporting period.
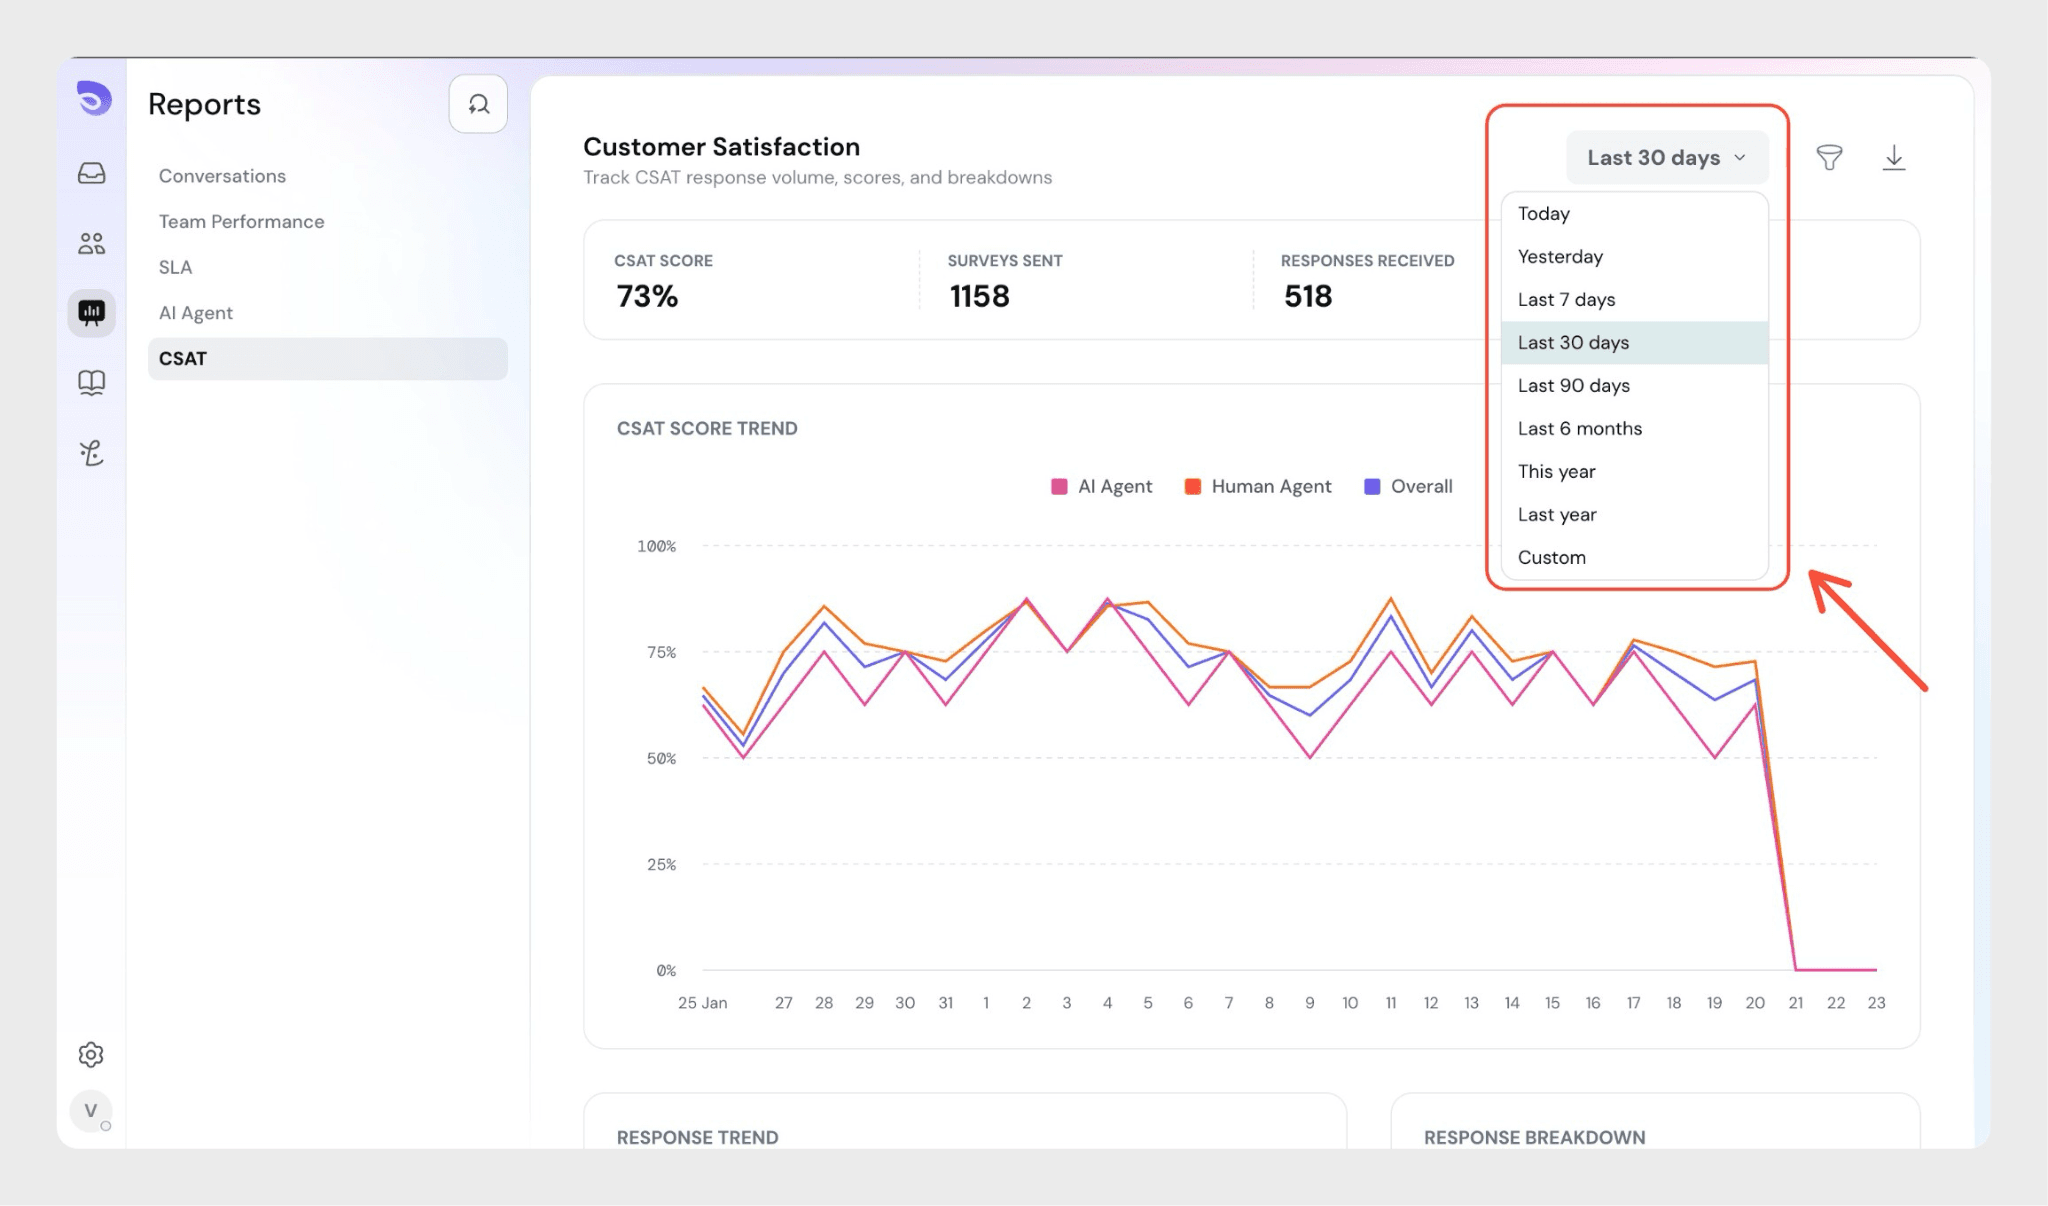
The CSAT Score Trend graph shows how satisfaction scores change over time.
You can compare:
This helps you identify patterns and measure improvements across different support types.
The Response Trend chart shows:
This helps you understand engagement levels and track participation over time.
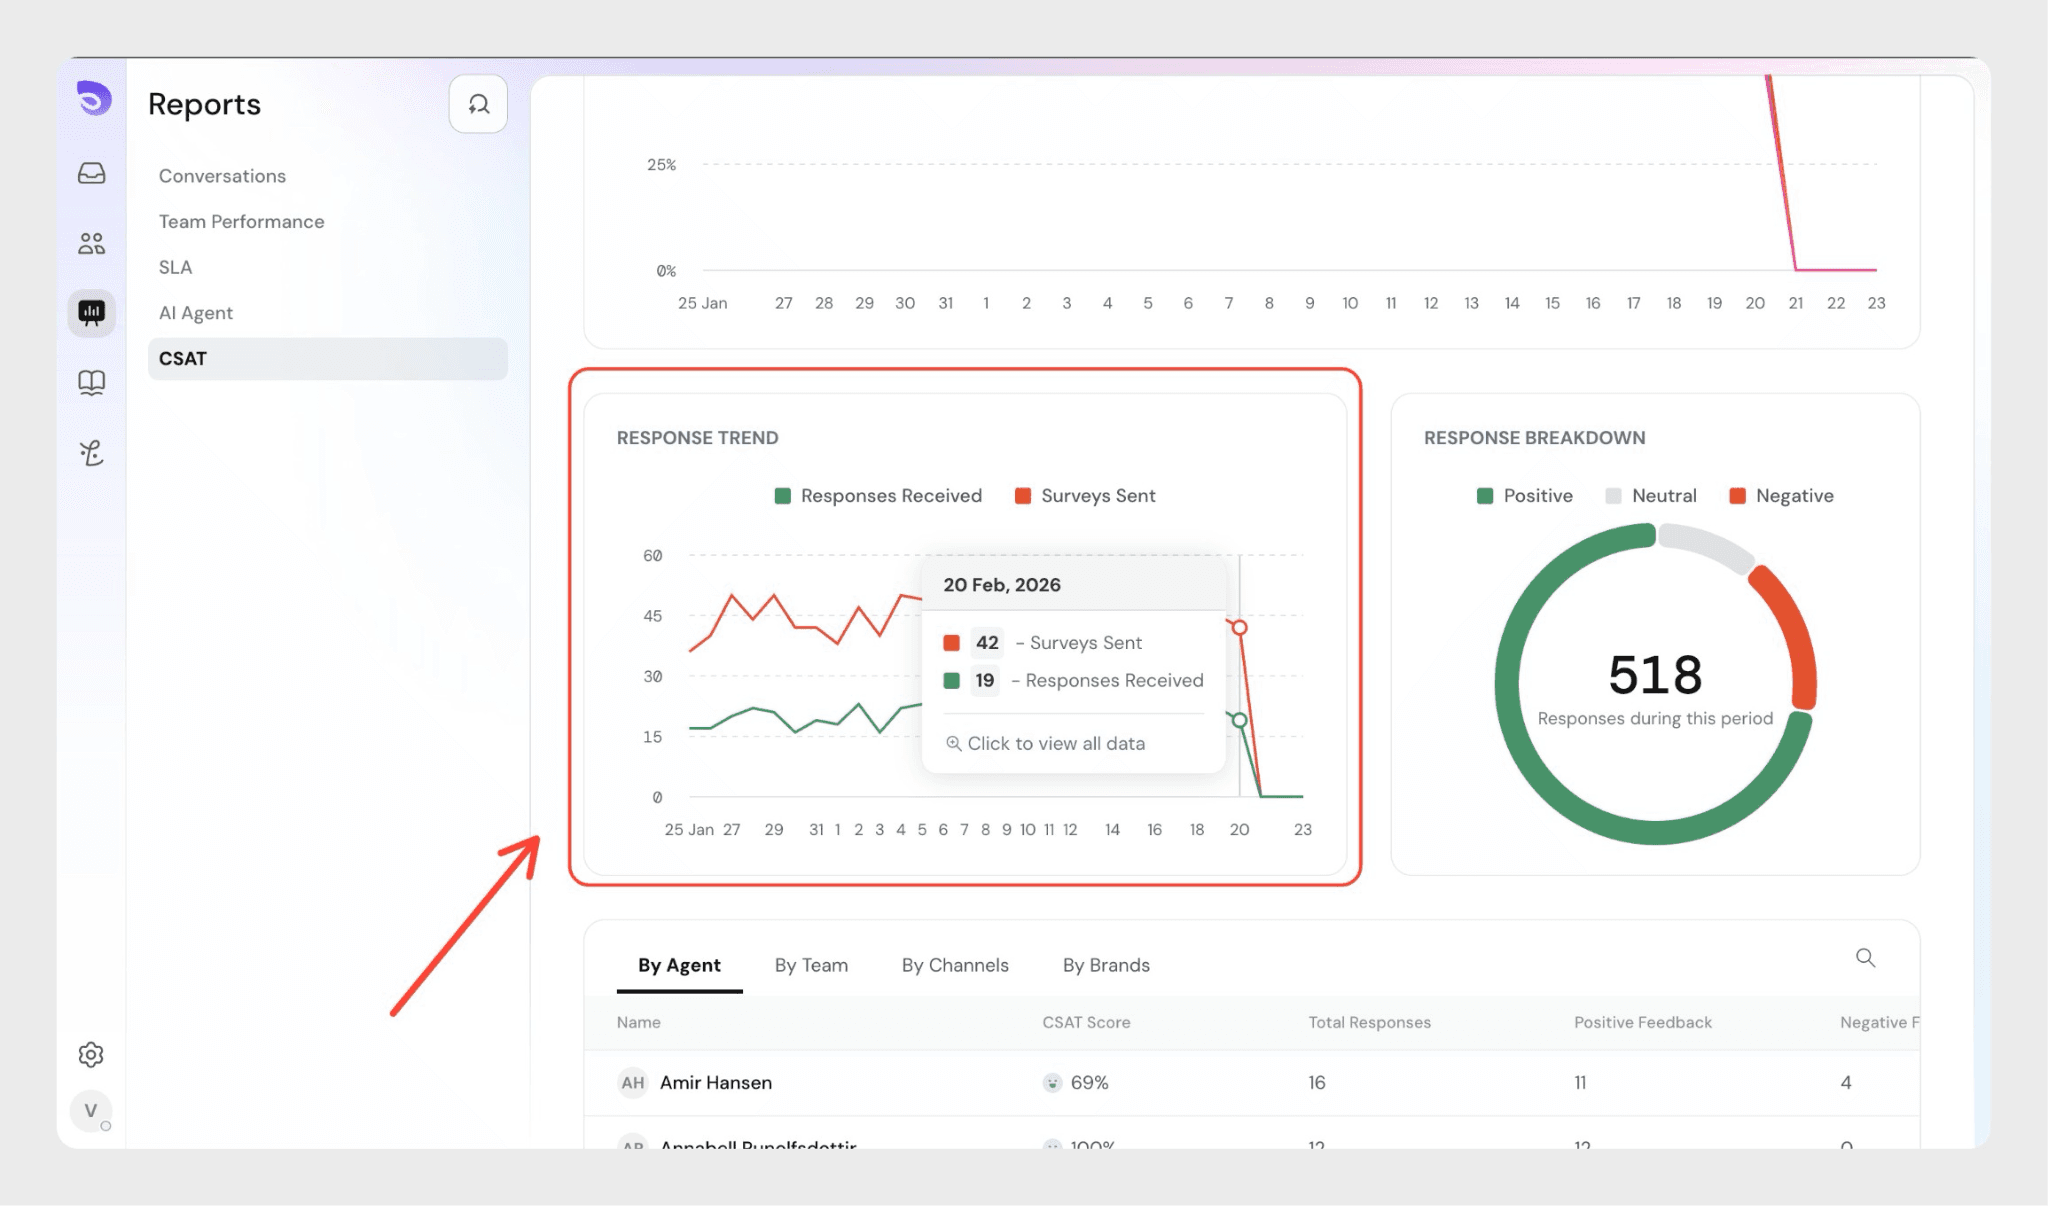
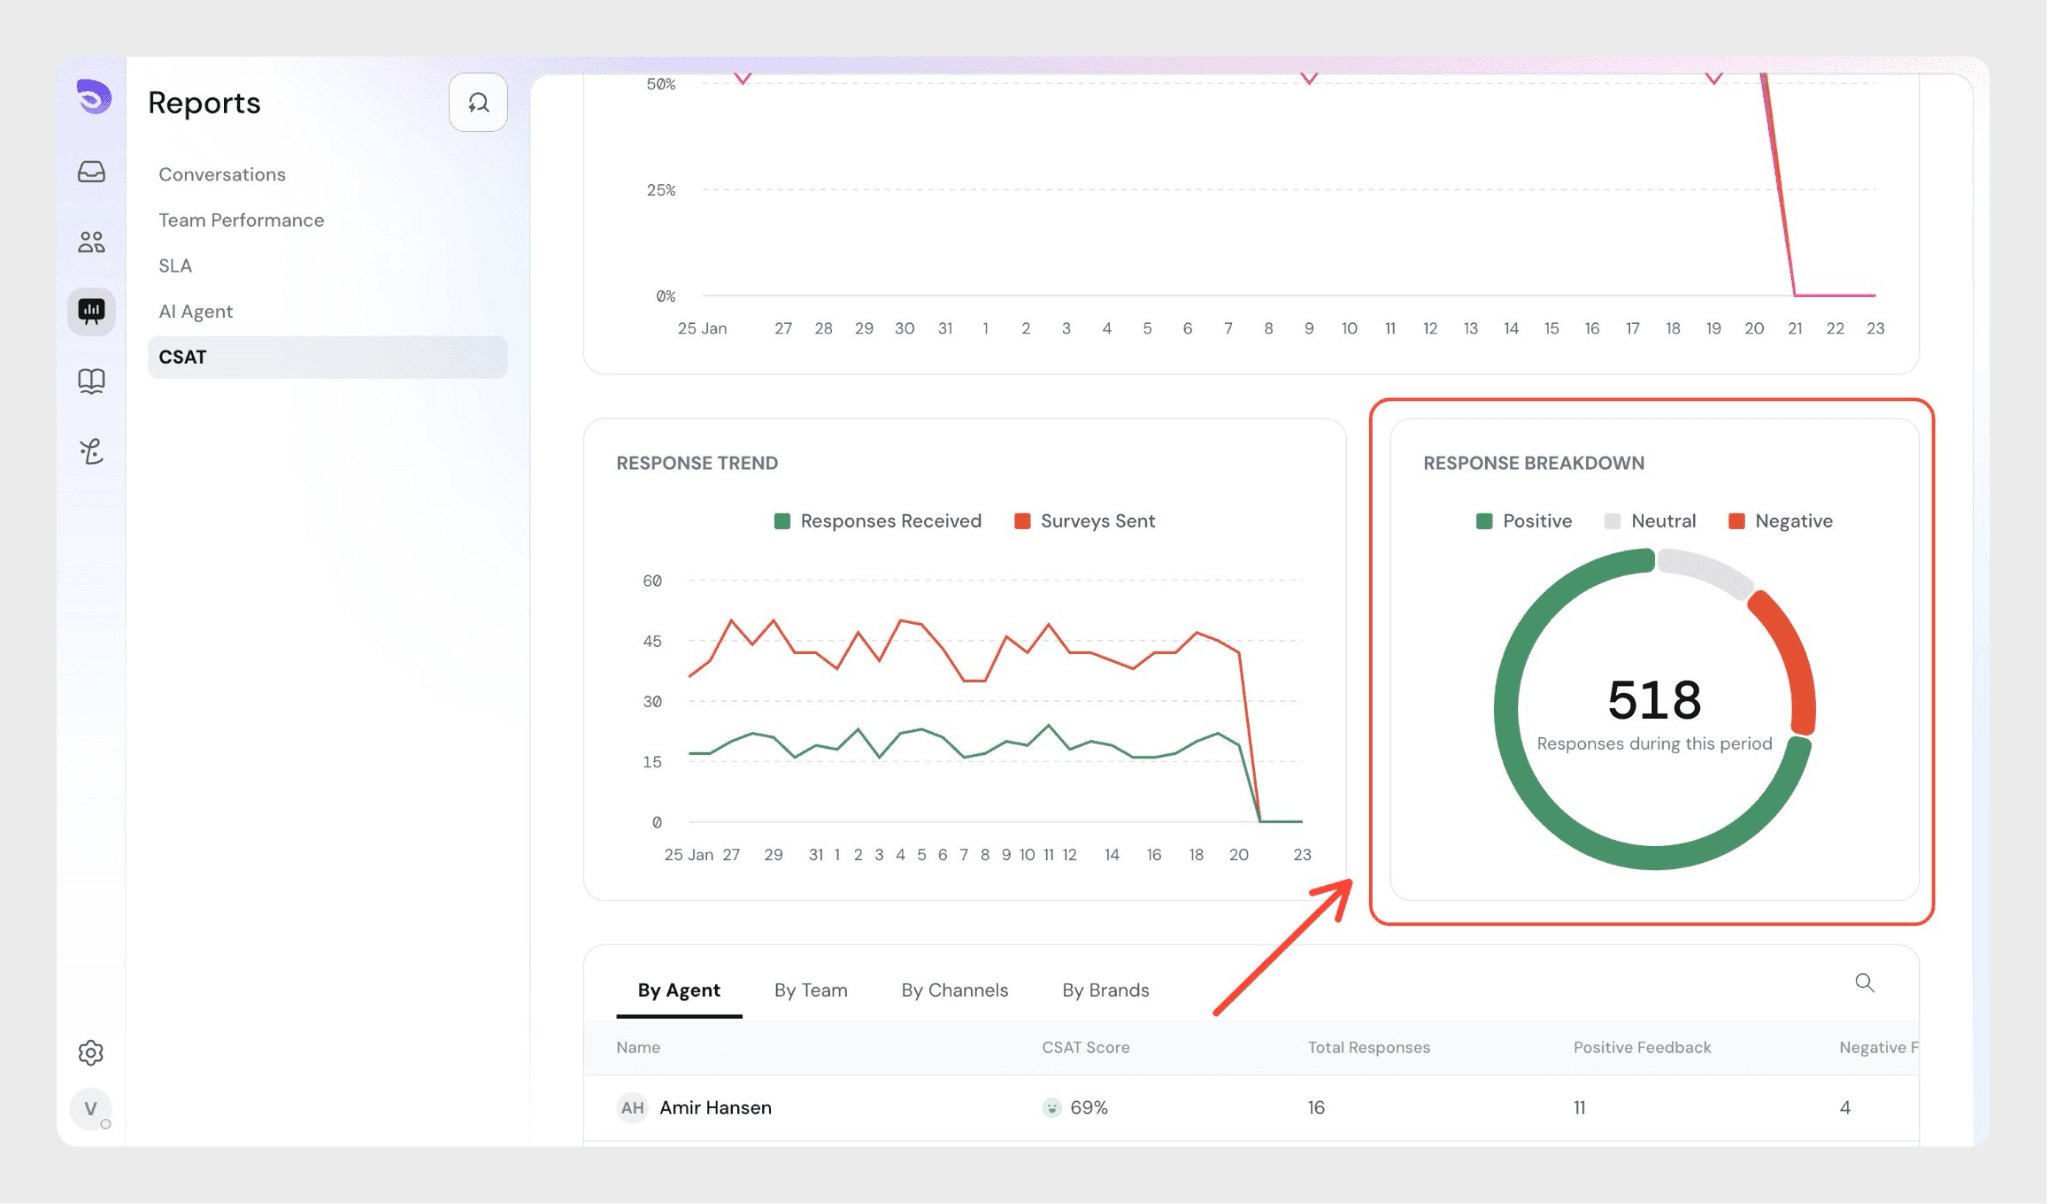
The Response Breakdown visual shows how feedback is distributed:
This gives a quick snapshot of overall customer sentiment during the selected period.
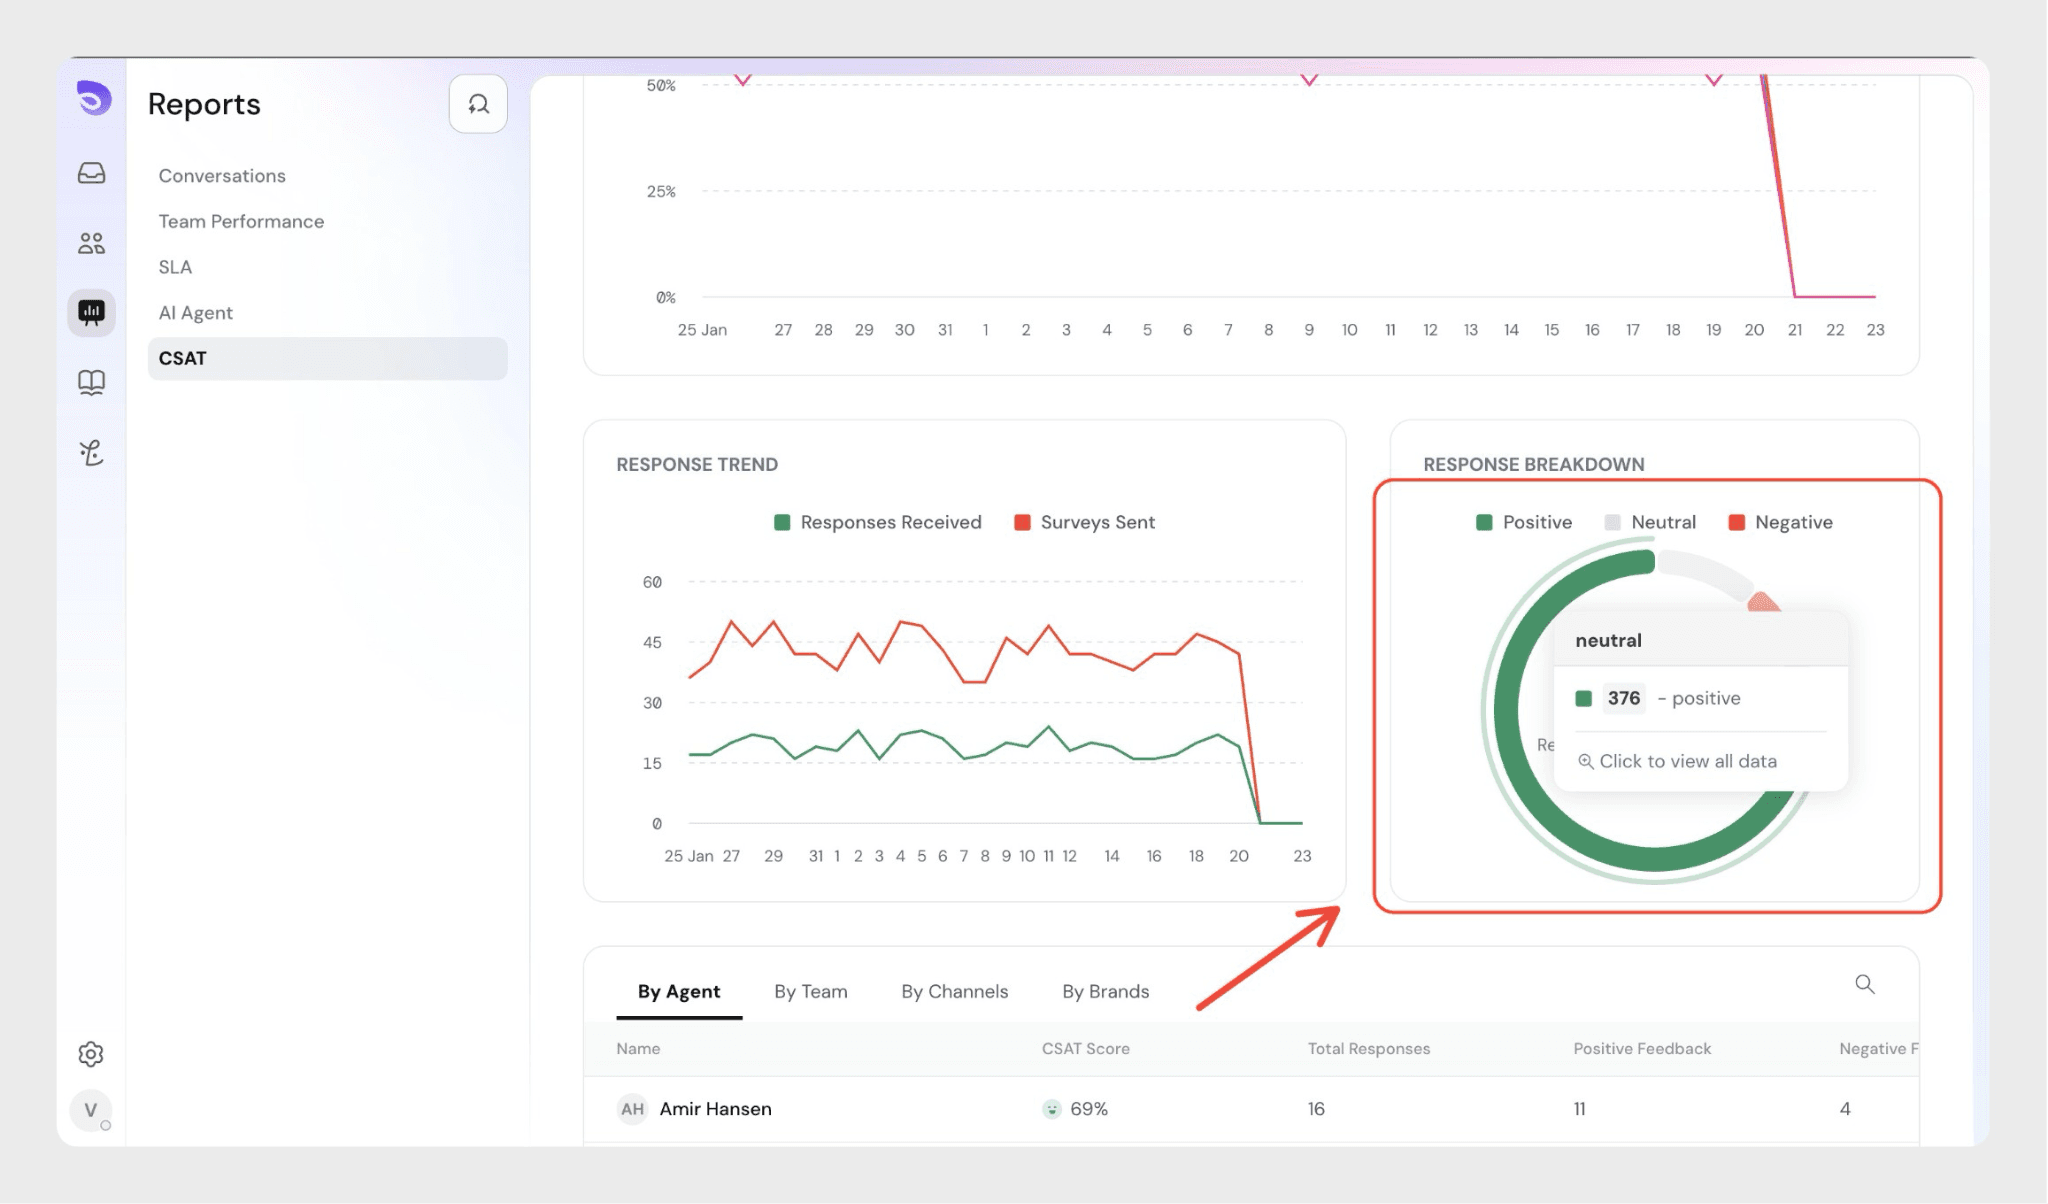
You can also click to view the positive and negative data.
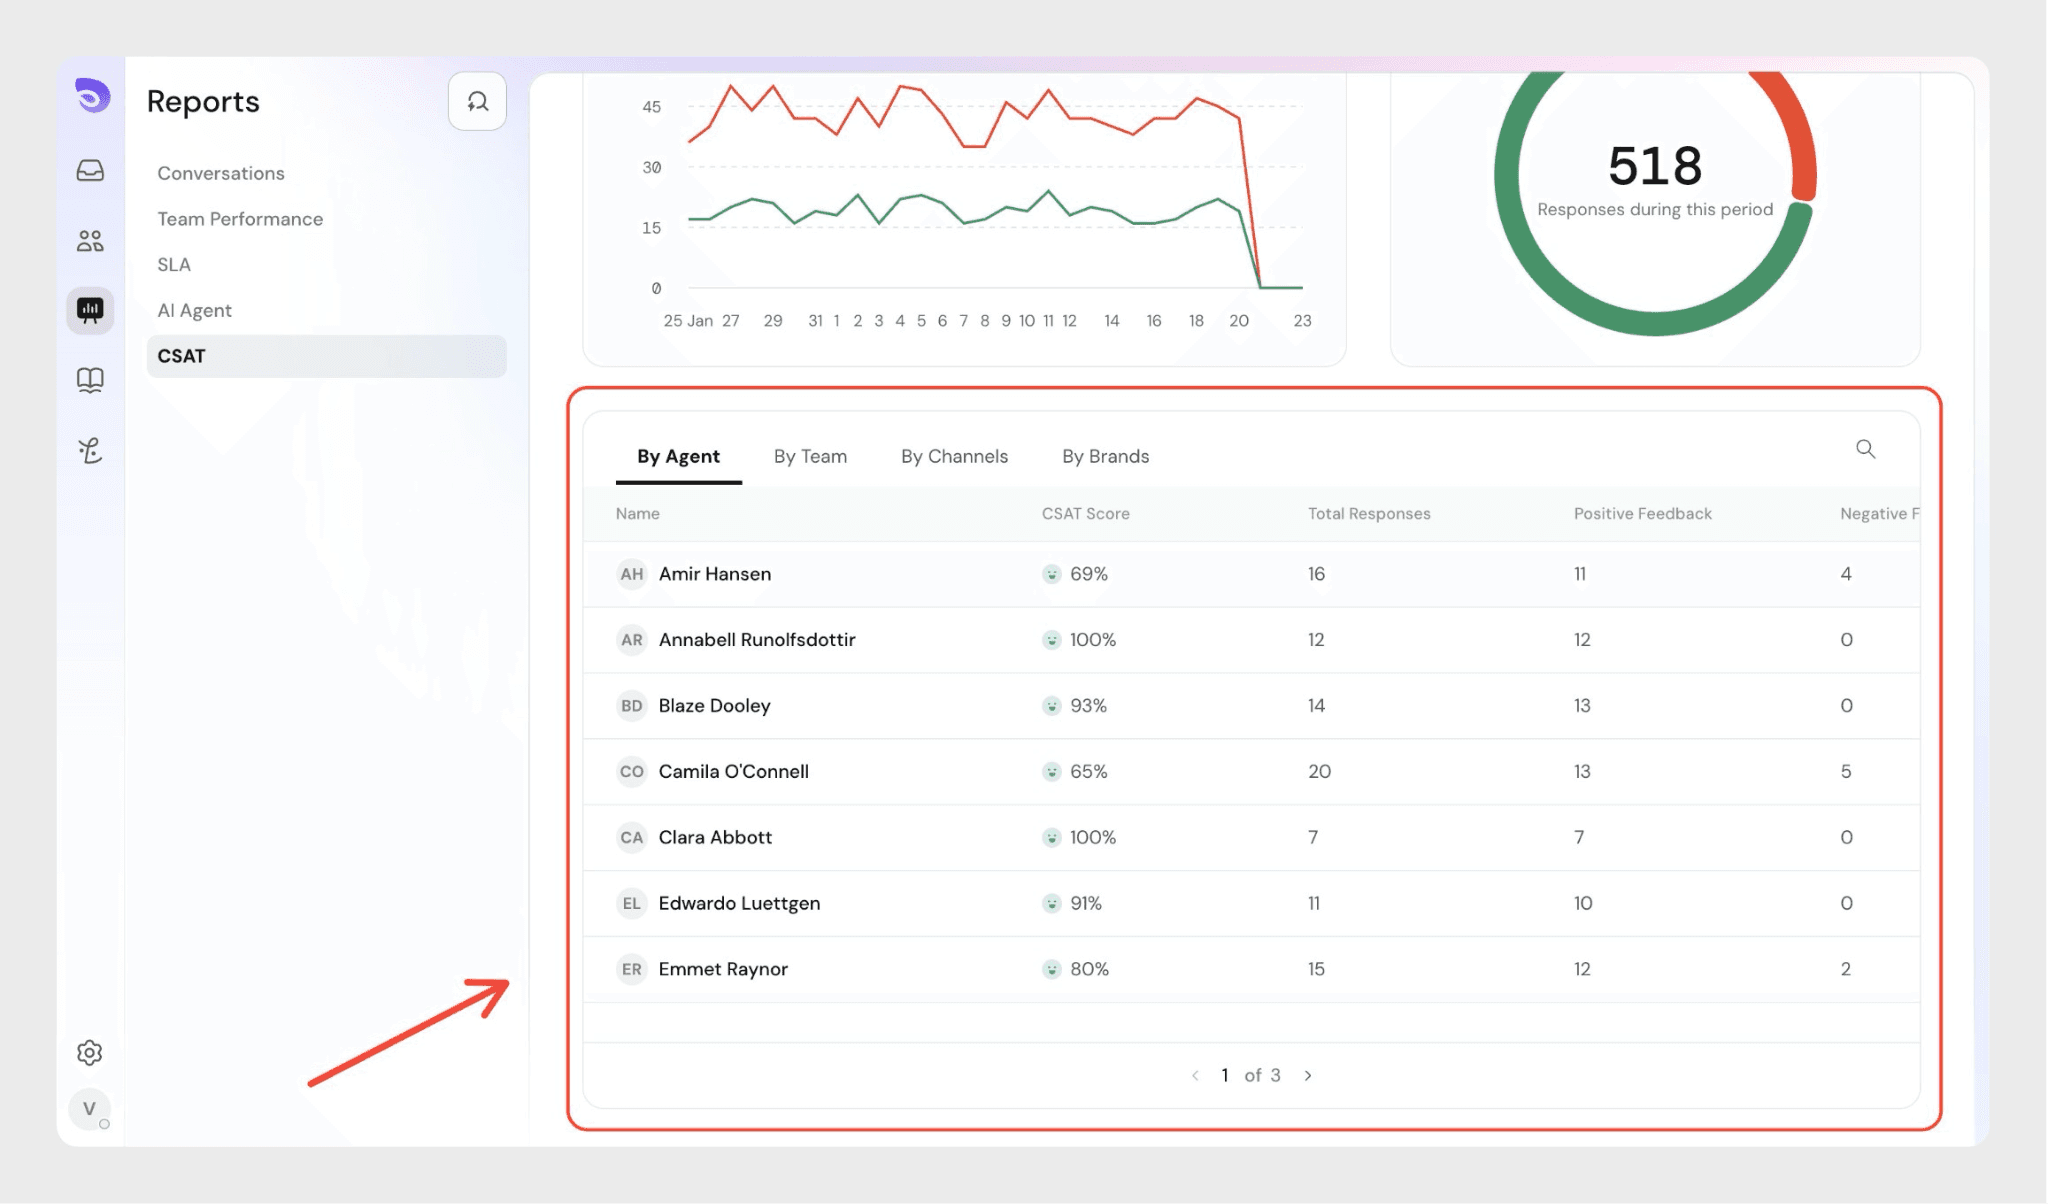
Below the charts, you can view detailed CSAT performance breakdowns:
Each table displays:
This allows you to evaluate individual and group performance.
You can:
CSAT Reports provide a clear view of customer sentiment and support performance. By regularly reviewing these insights, teams can make informed decisions to improve service quality and customer experience.
Powered By SparrowDesk