Search
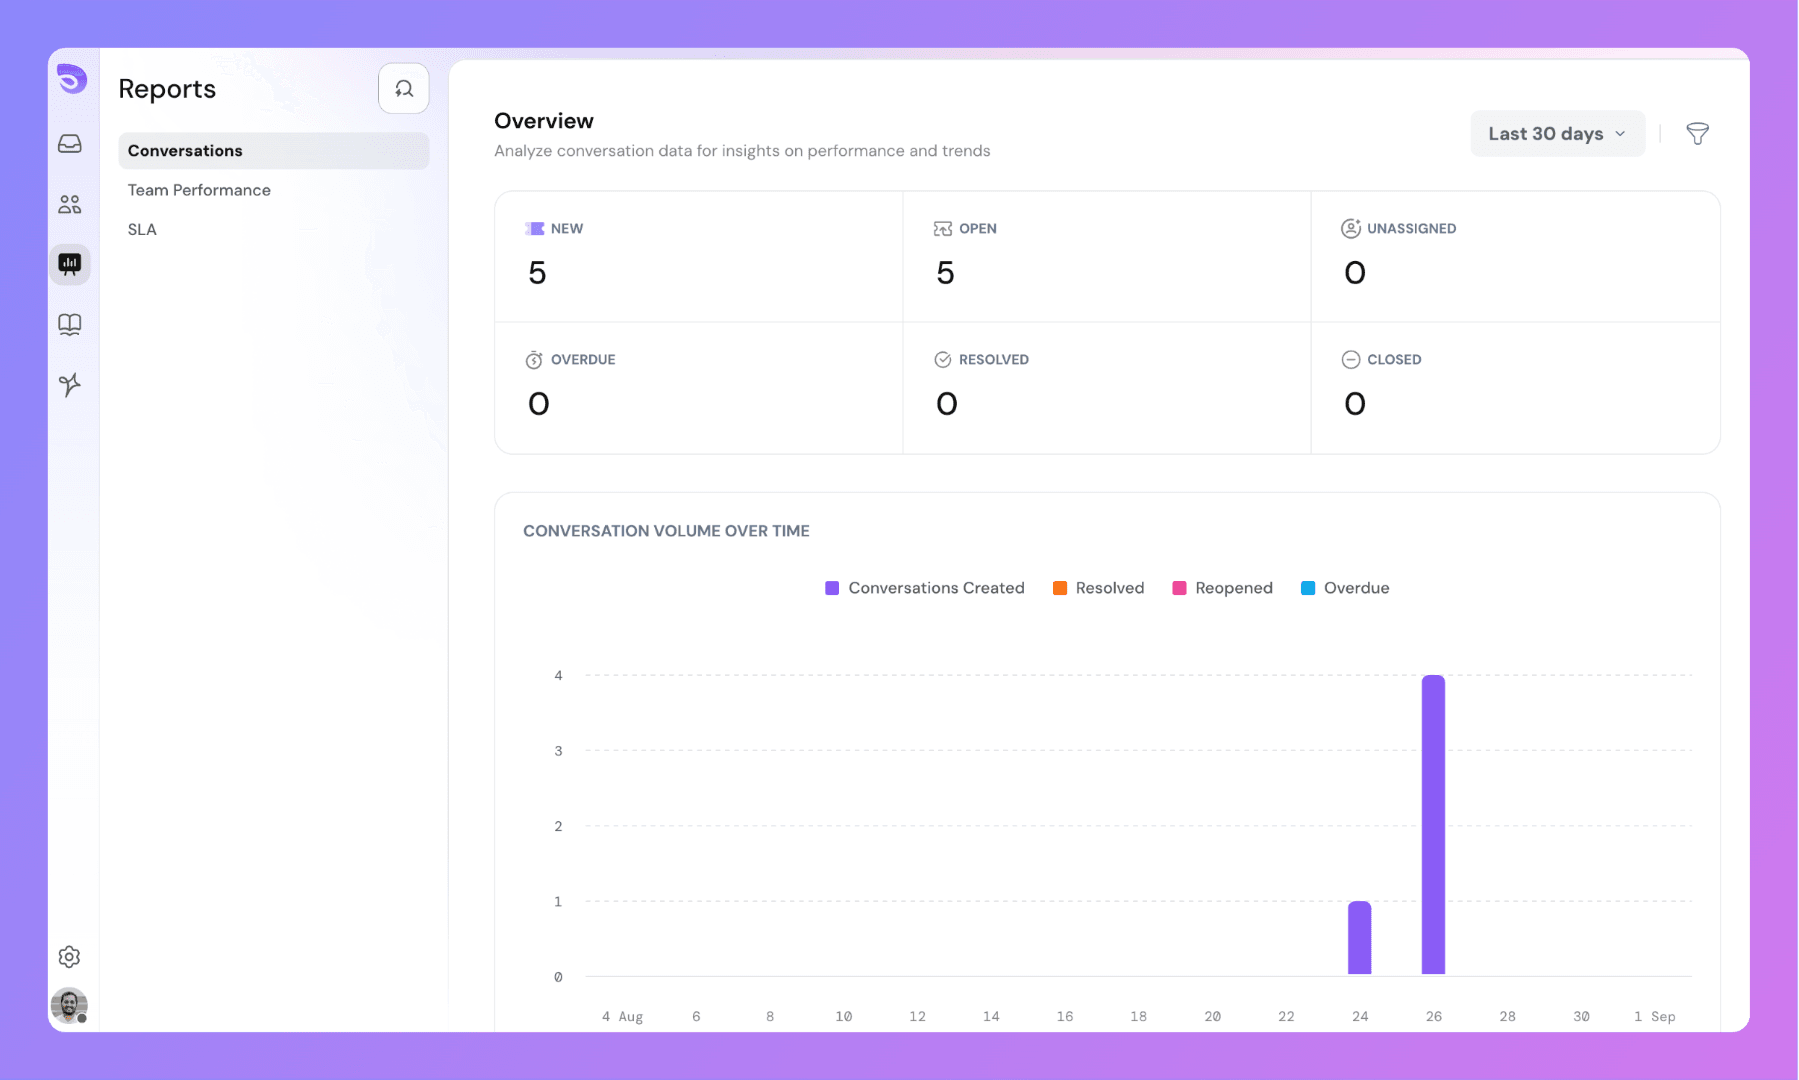
The Conversation Report in SparrowDesk gives support managers and admins a detailed, visual view of their support operations. It helps you track key metrics, understand performance trends, monitor SLA compliance, and identify areas for improvement across your support channels.
Only users who have permission to access the Reports module will be able to view the Conversation Report.
The Conversation Report includes several key metrics and visualizations to help you monitor support activity effectively. All metrics support drill-down—clicking on a number or chart takes you to the actual conversations behind the data.
Each metric listed below can be filtered by date range and conversation properties (default or custom):
SparrowDesk includes multiple visualizations to help you interpret data faster:
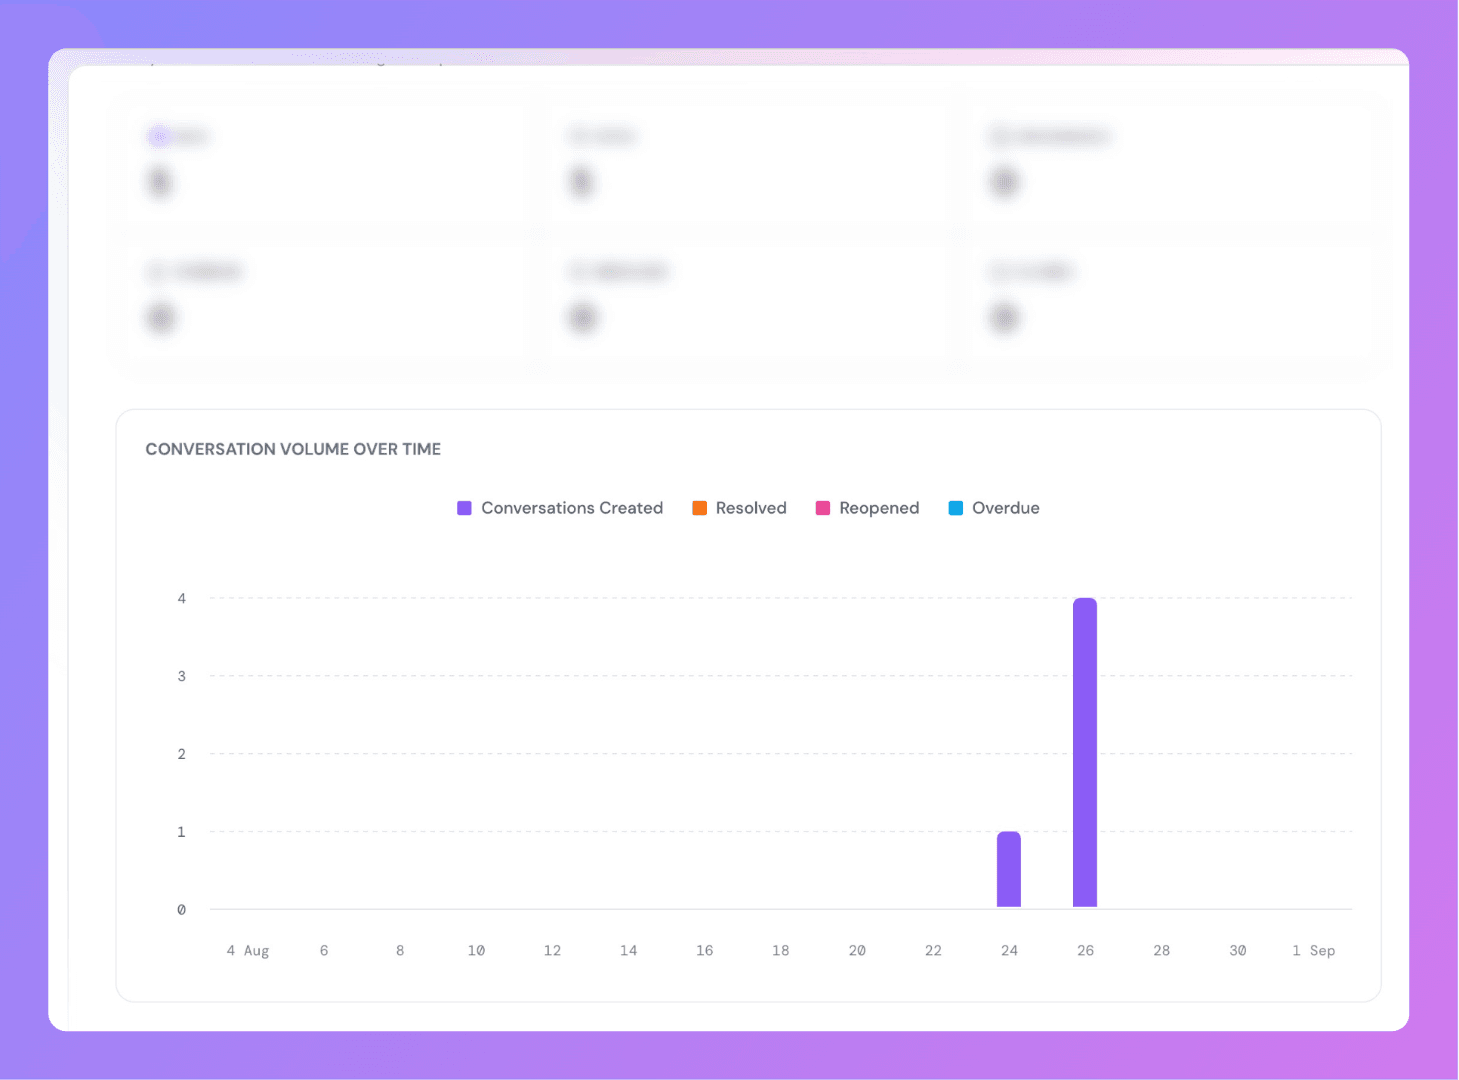
Conversation Volume Over Time: Graph showing Created, Overdue, Resolved, and Reopened conversations by day.
Conversations by Priority: Chart showing the number of conversations based on priority (Low, Medium, High, Urgent).
Conversations by Source: Pie chart that breaks down conversations by channel (e.g., Email, Chat).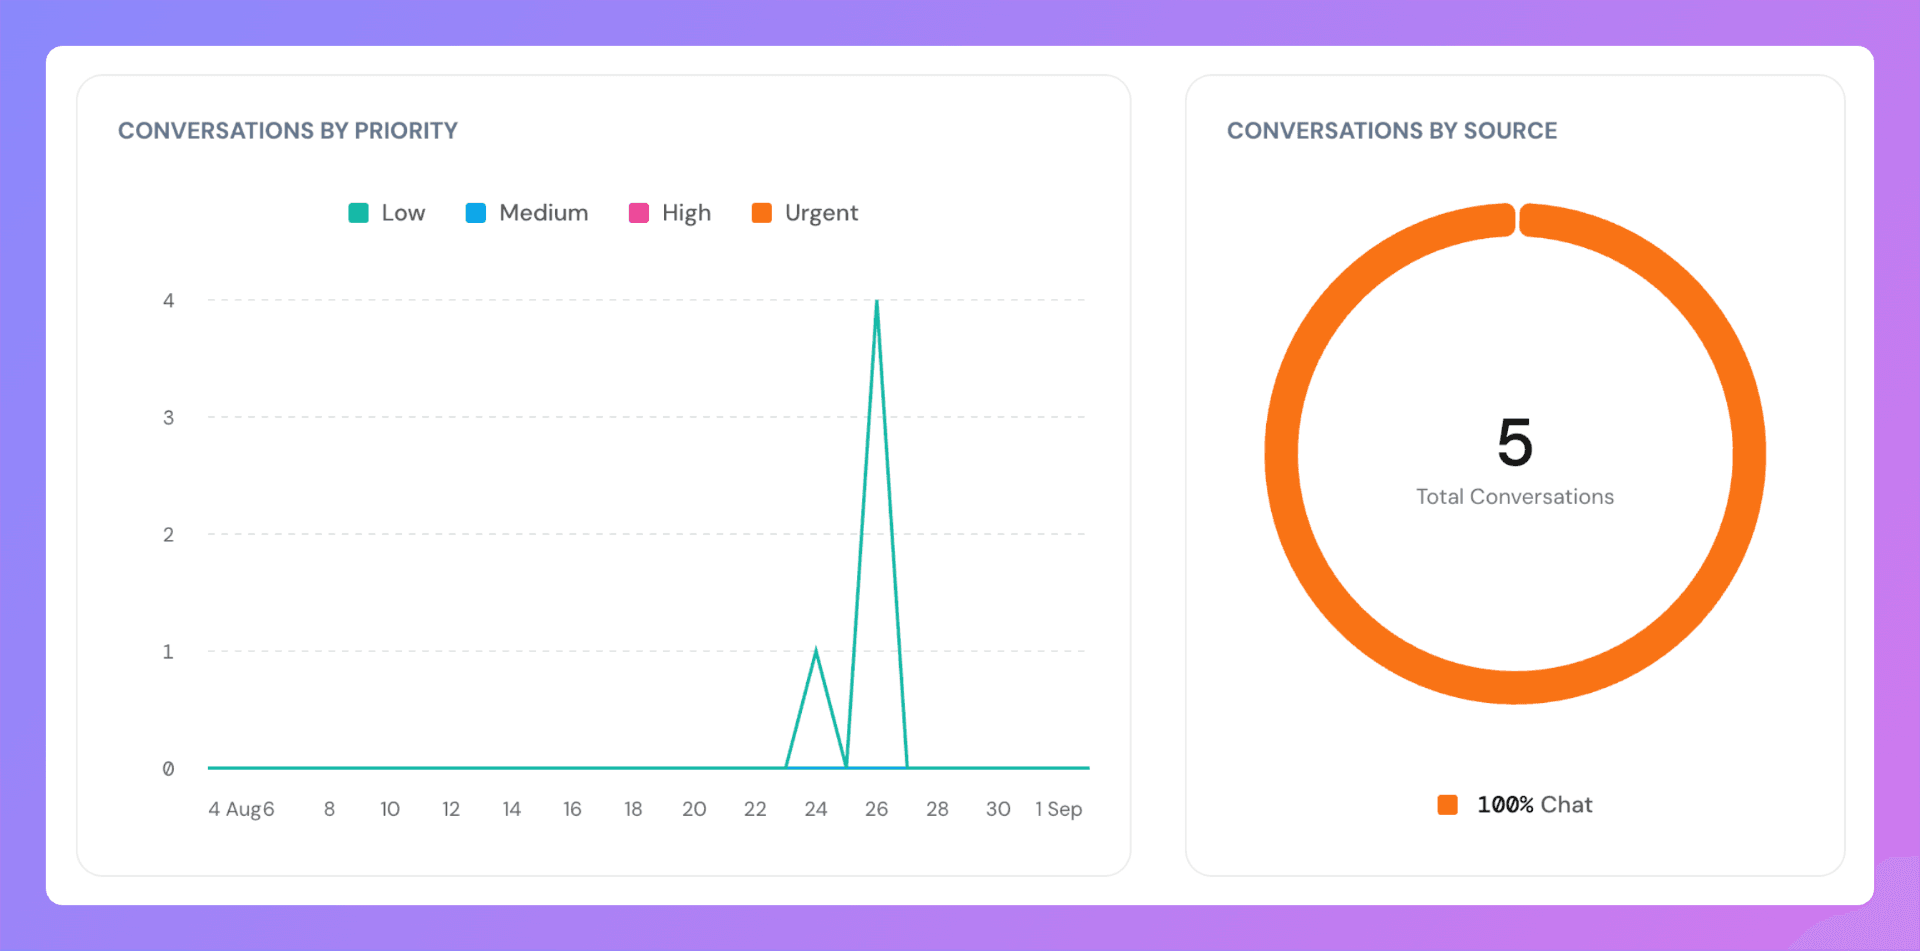
By default, the Conversation Report shows data from the last 30 days. You can change this using the date filter to select a specific time range.
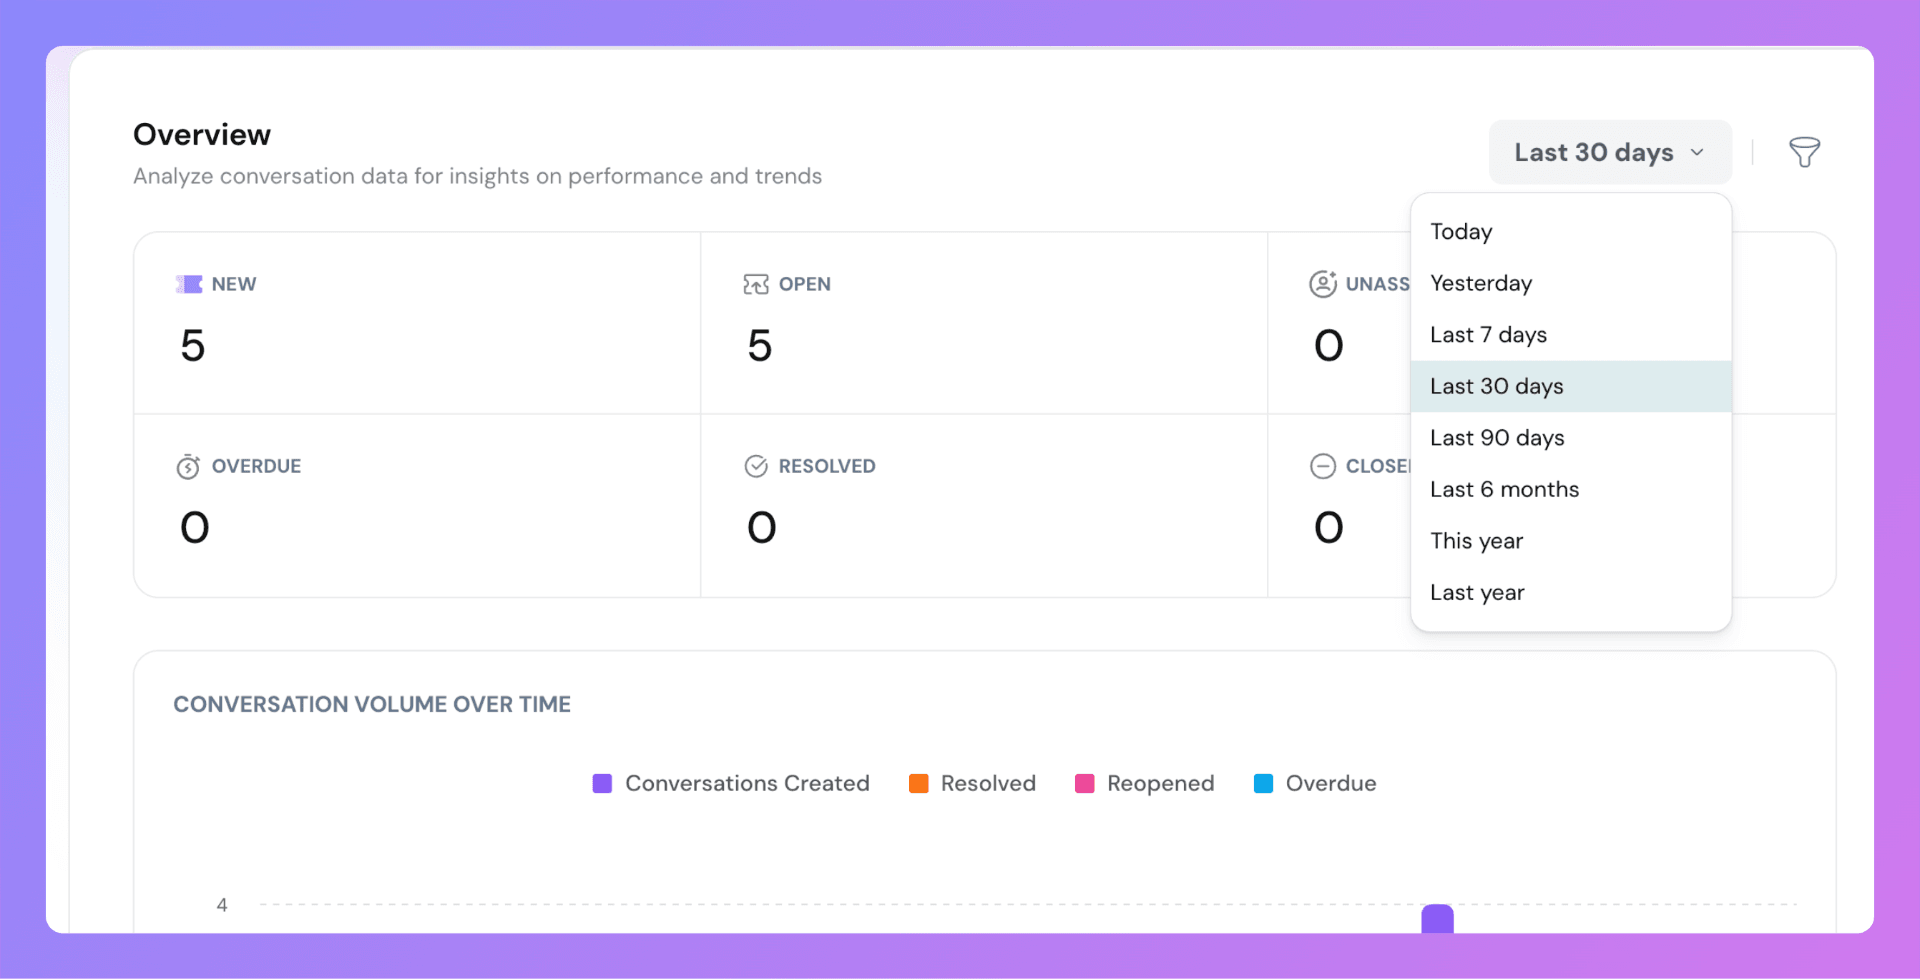
These filters apply across all widgets and KPIs in the report.
At the moment, SparrowDesk does not support:
These capabilities are part of our product roadmap and will be introduced in future updates.
Powered By SparrowDesk