
Build a Custom Report

Custom Reports let you build your own report with the metrics, charts, and breakdowns your team wants to track.
Who can use Custom Reports
Custom Reports are available on the Professional plan and above. Only admins with the Manage reports permission can create or edit a report. Anyone who can view a report can also download it.
Find Custom Reports
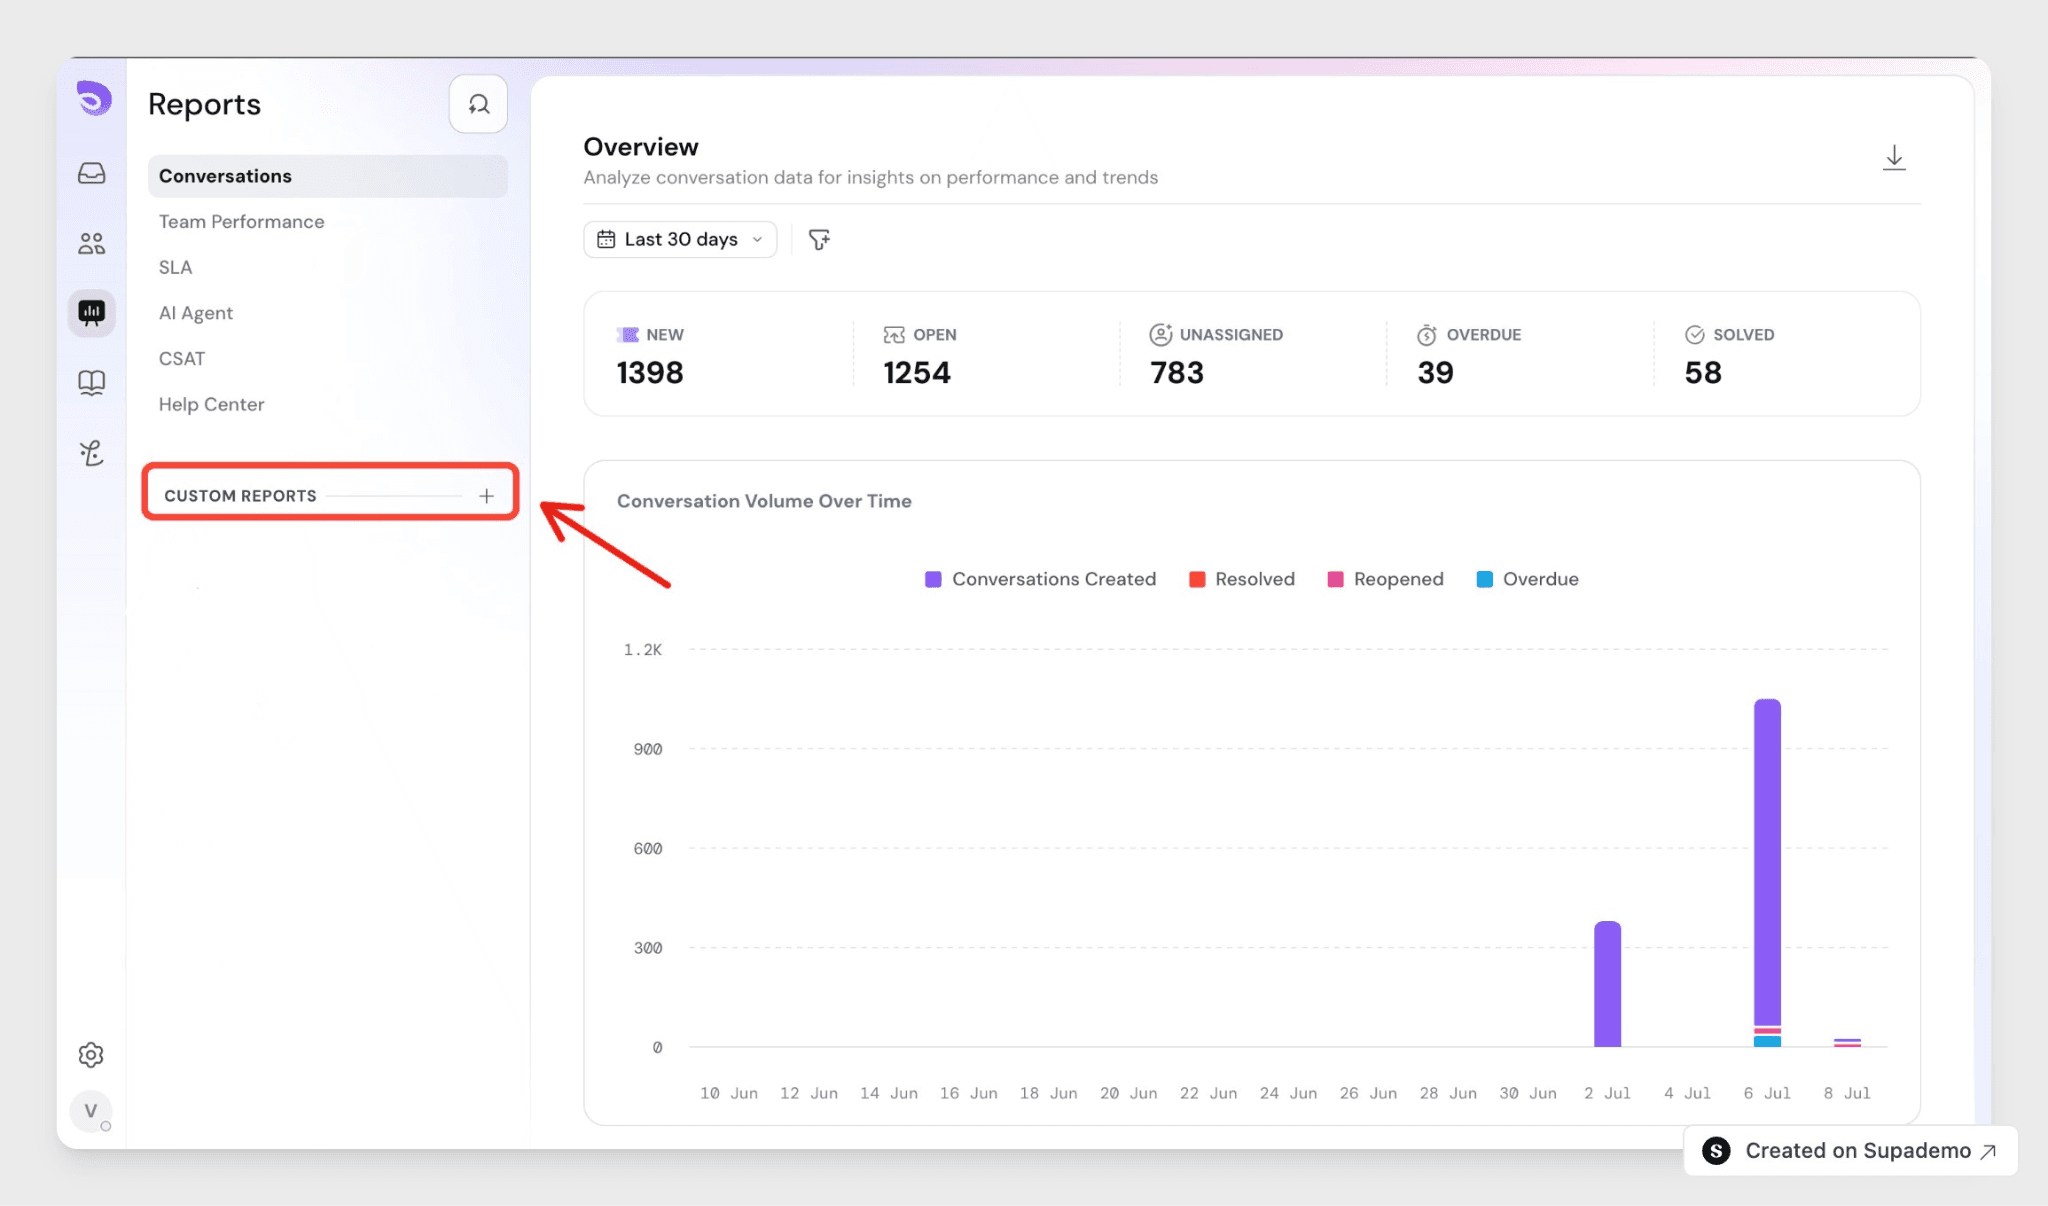
Custom Reports lives in the Reports area in the left navigation, below your default reports (Conversations, Team Performance, SLA, AI Agent, and CSAT). Default reports can't be edited or deleted.
Open the Custom Reports section and click + New Report. New reports are added to the bottom of the list.
Create a report
Click + New Report. SparrowDesk creates the report and opens an empty page right away. There's no naming step first, so you can rename the report at any time using the report title.
Every change saves automatically. There is no separate Save button for the report.
Create a widget with AI
A widget is a single chart, table, or number inside your report. You can build one yourself in the widget builder, or describe what you want and let AI draft it for you.
Not sure which metric or chart you need? You can describe the widget you want in plain words, and SparrowDesk builds it for you.
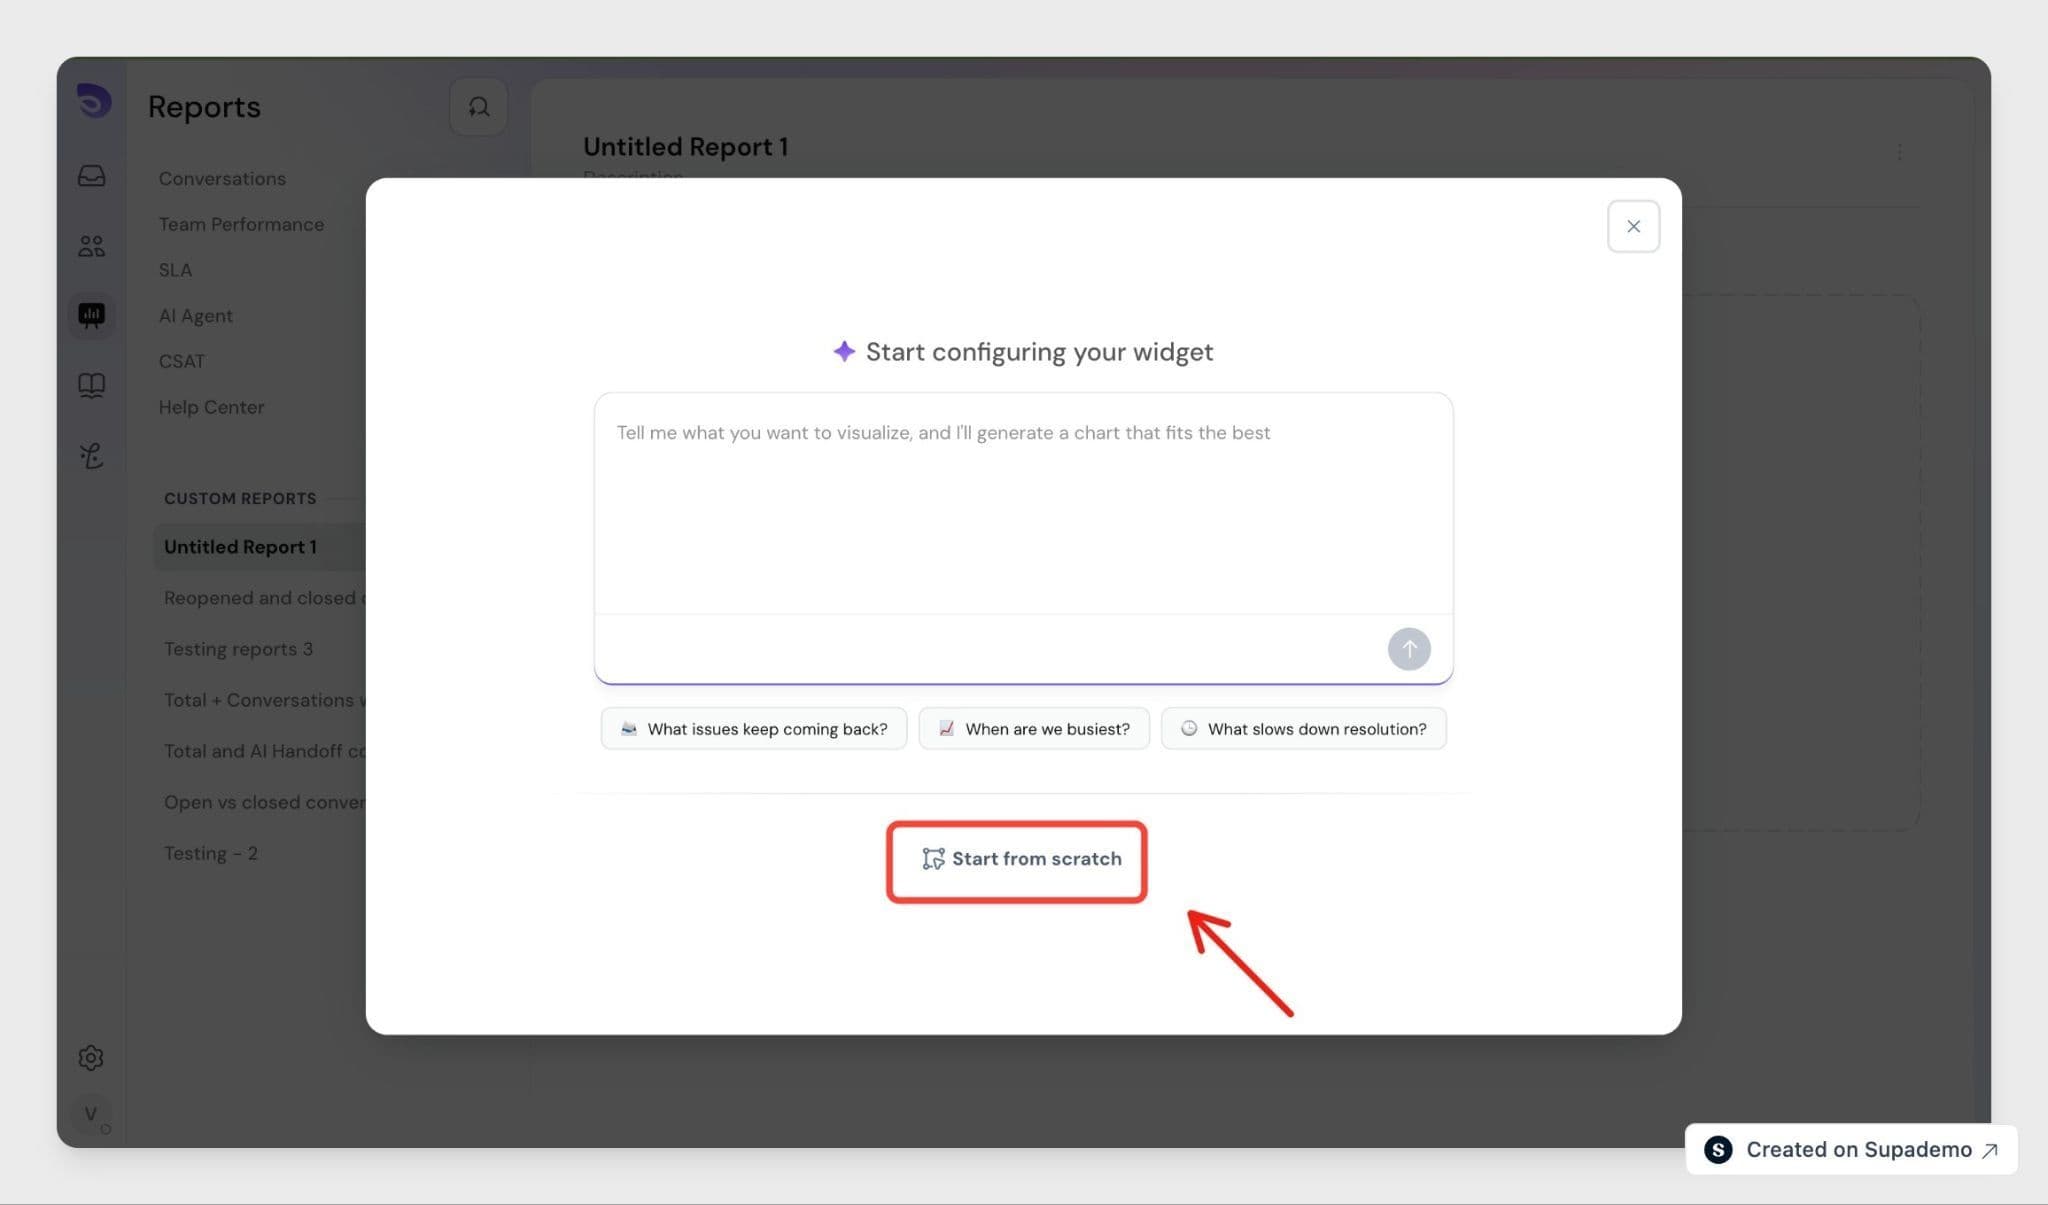
Click + Add Widget and choose Create with AI. Type what you'd like to see, for example "open versus resolved conversations this month", or pick one of the example prompts to get going. SparrowDesk reads your request and builds a matching chart on the spot.
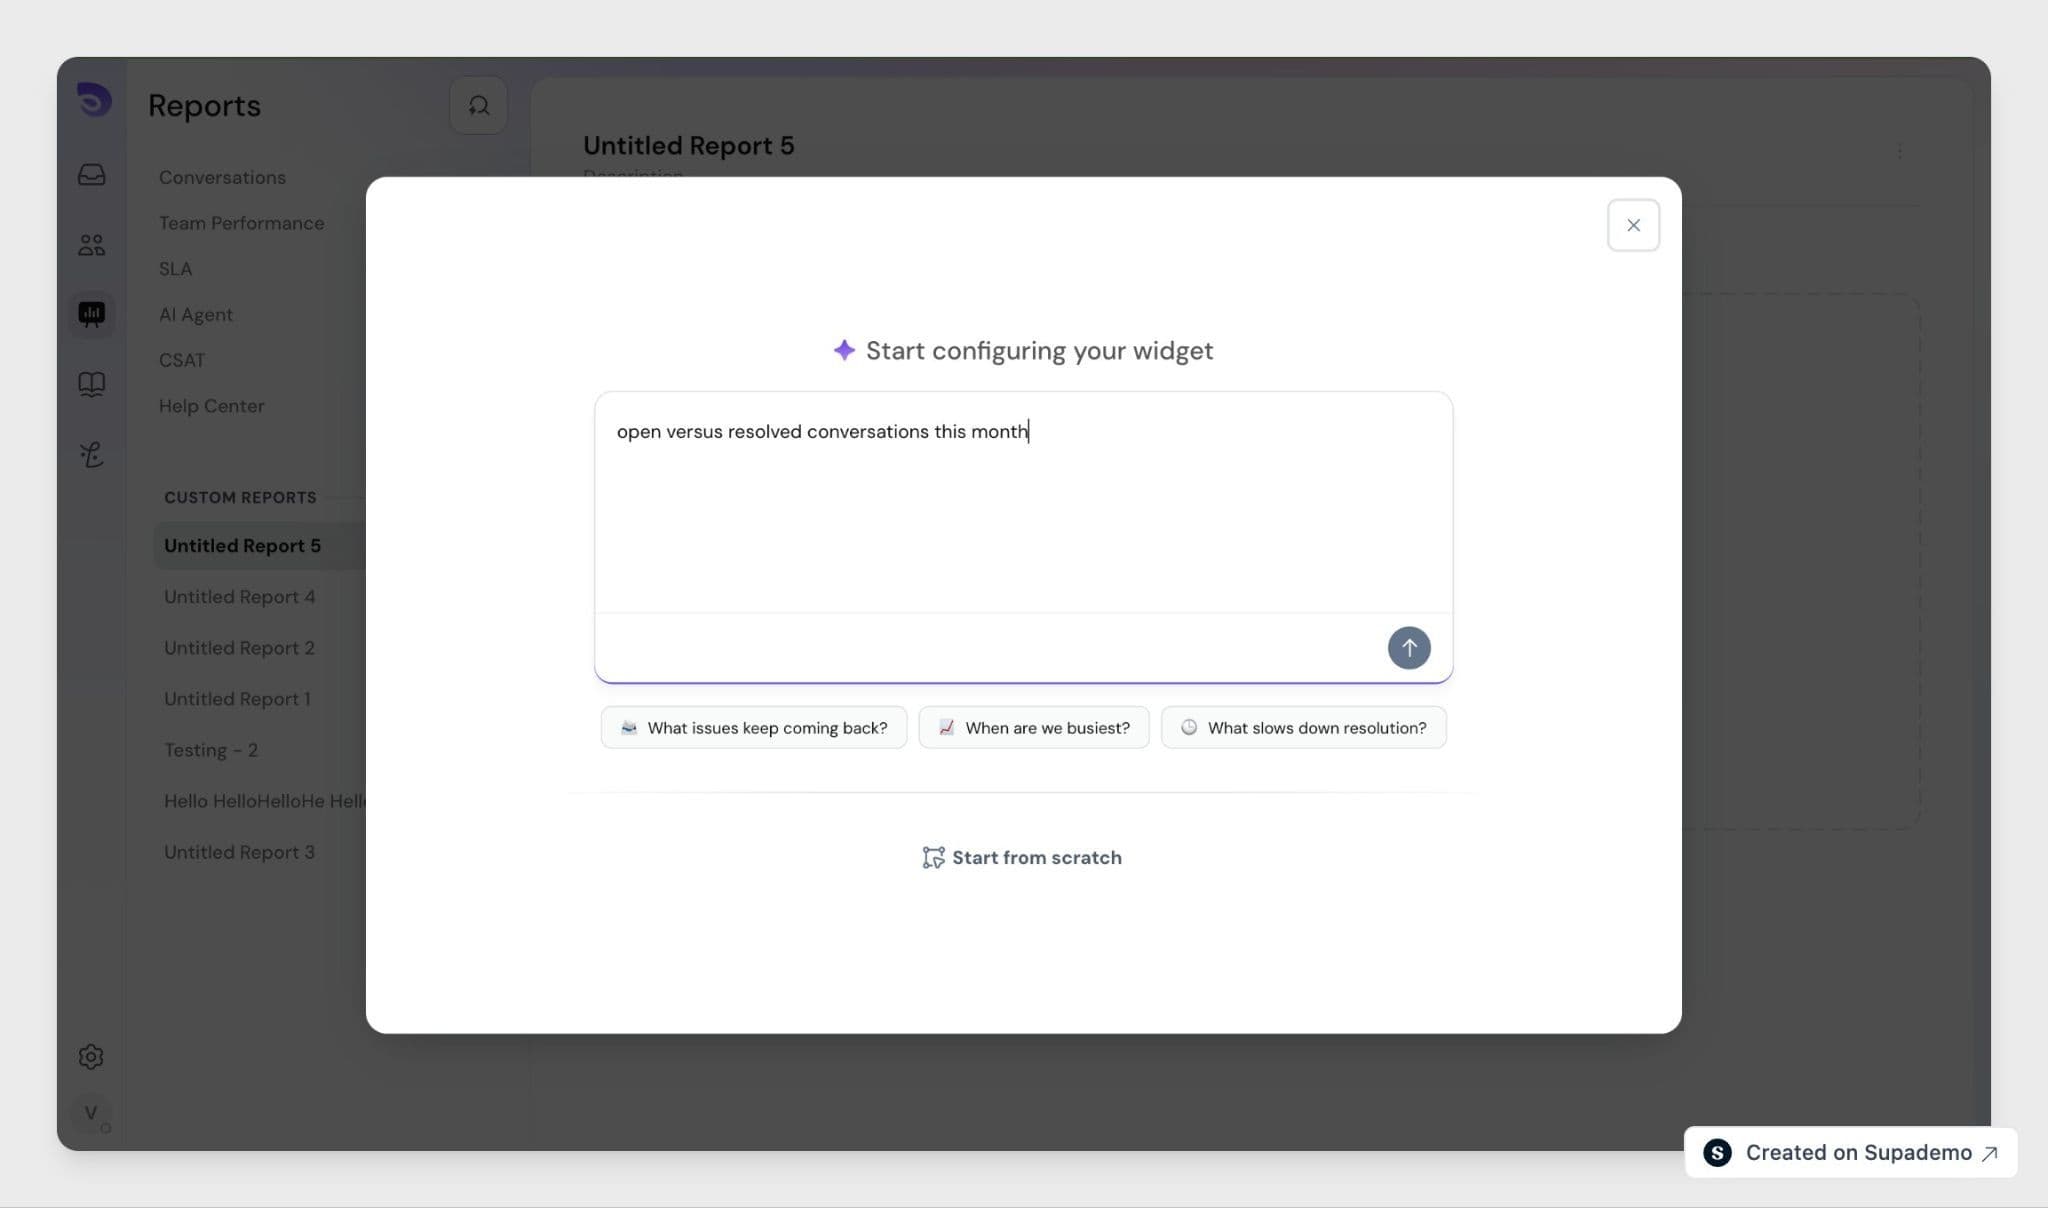
If your request could point to more than one thing, SparrowDesk asks a quick question and gives you a few options to choose from. Pick one, and it finishes the widget.
Alongside the chart, you'll see a short summary of what the data is telling you, such as whether a number is rising or falling. It's there to help you make sense of the widget before you keep it.
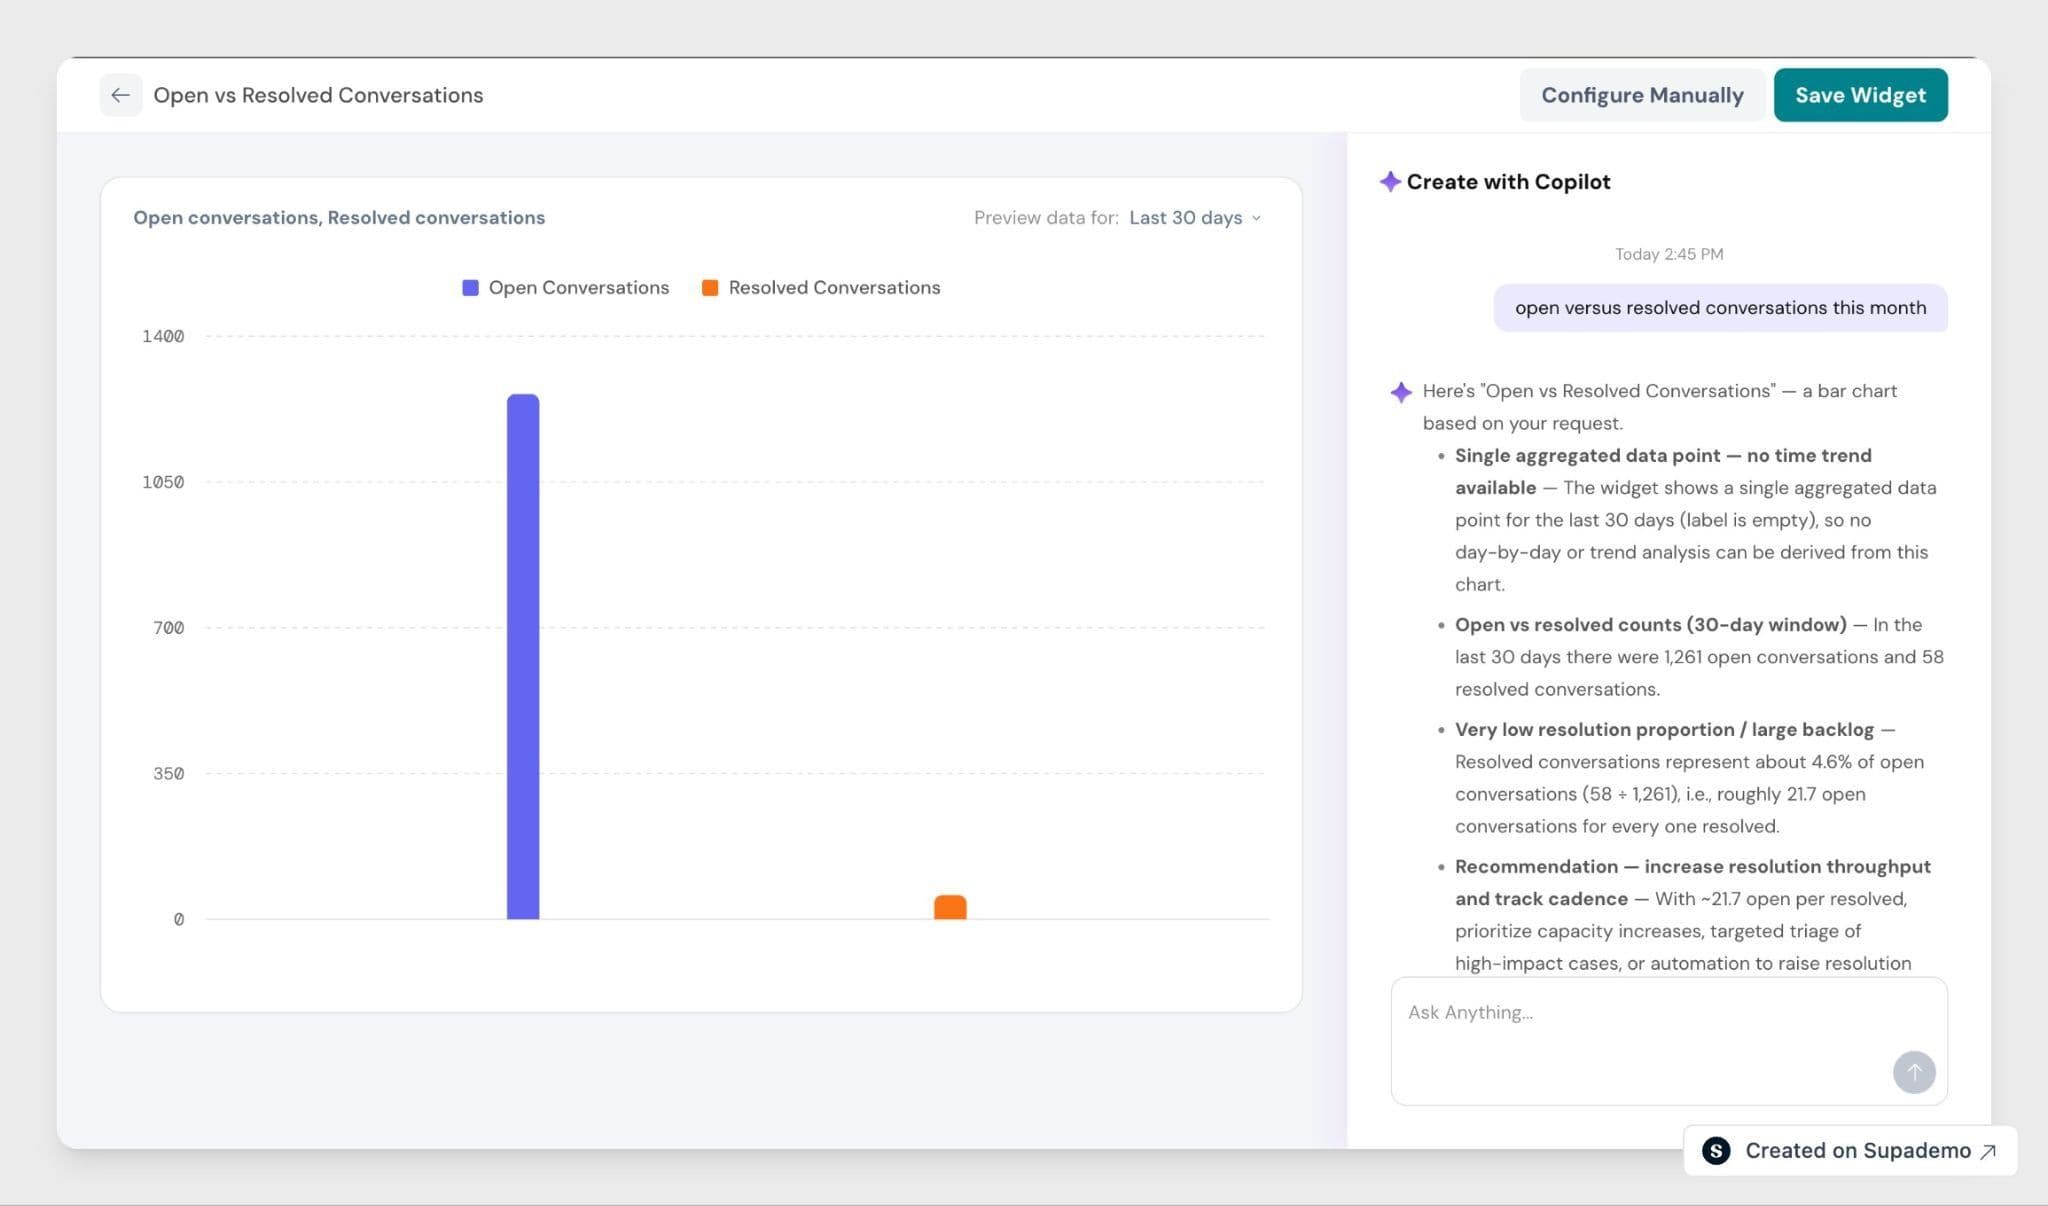
Happy with it? Click Save Widget to add it to your report.
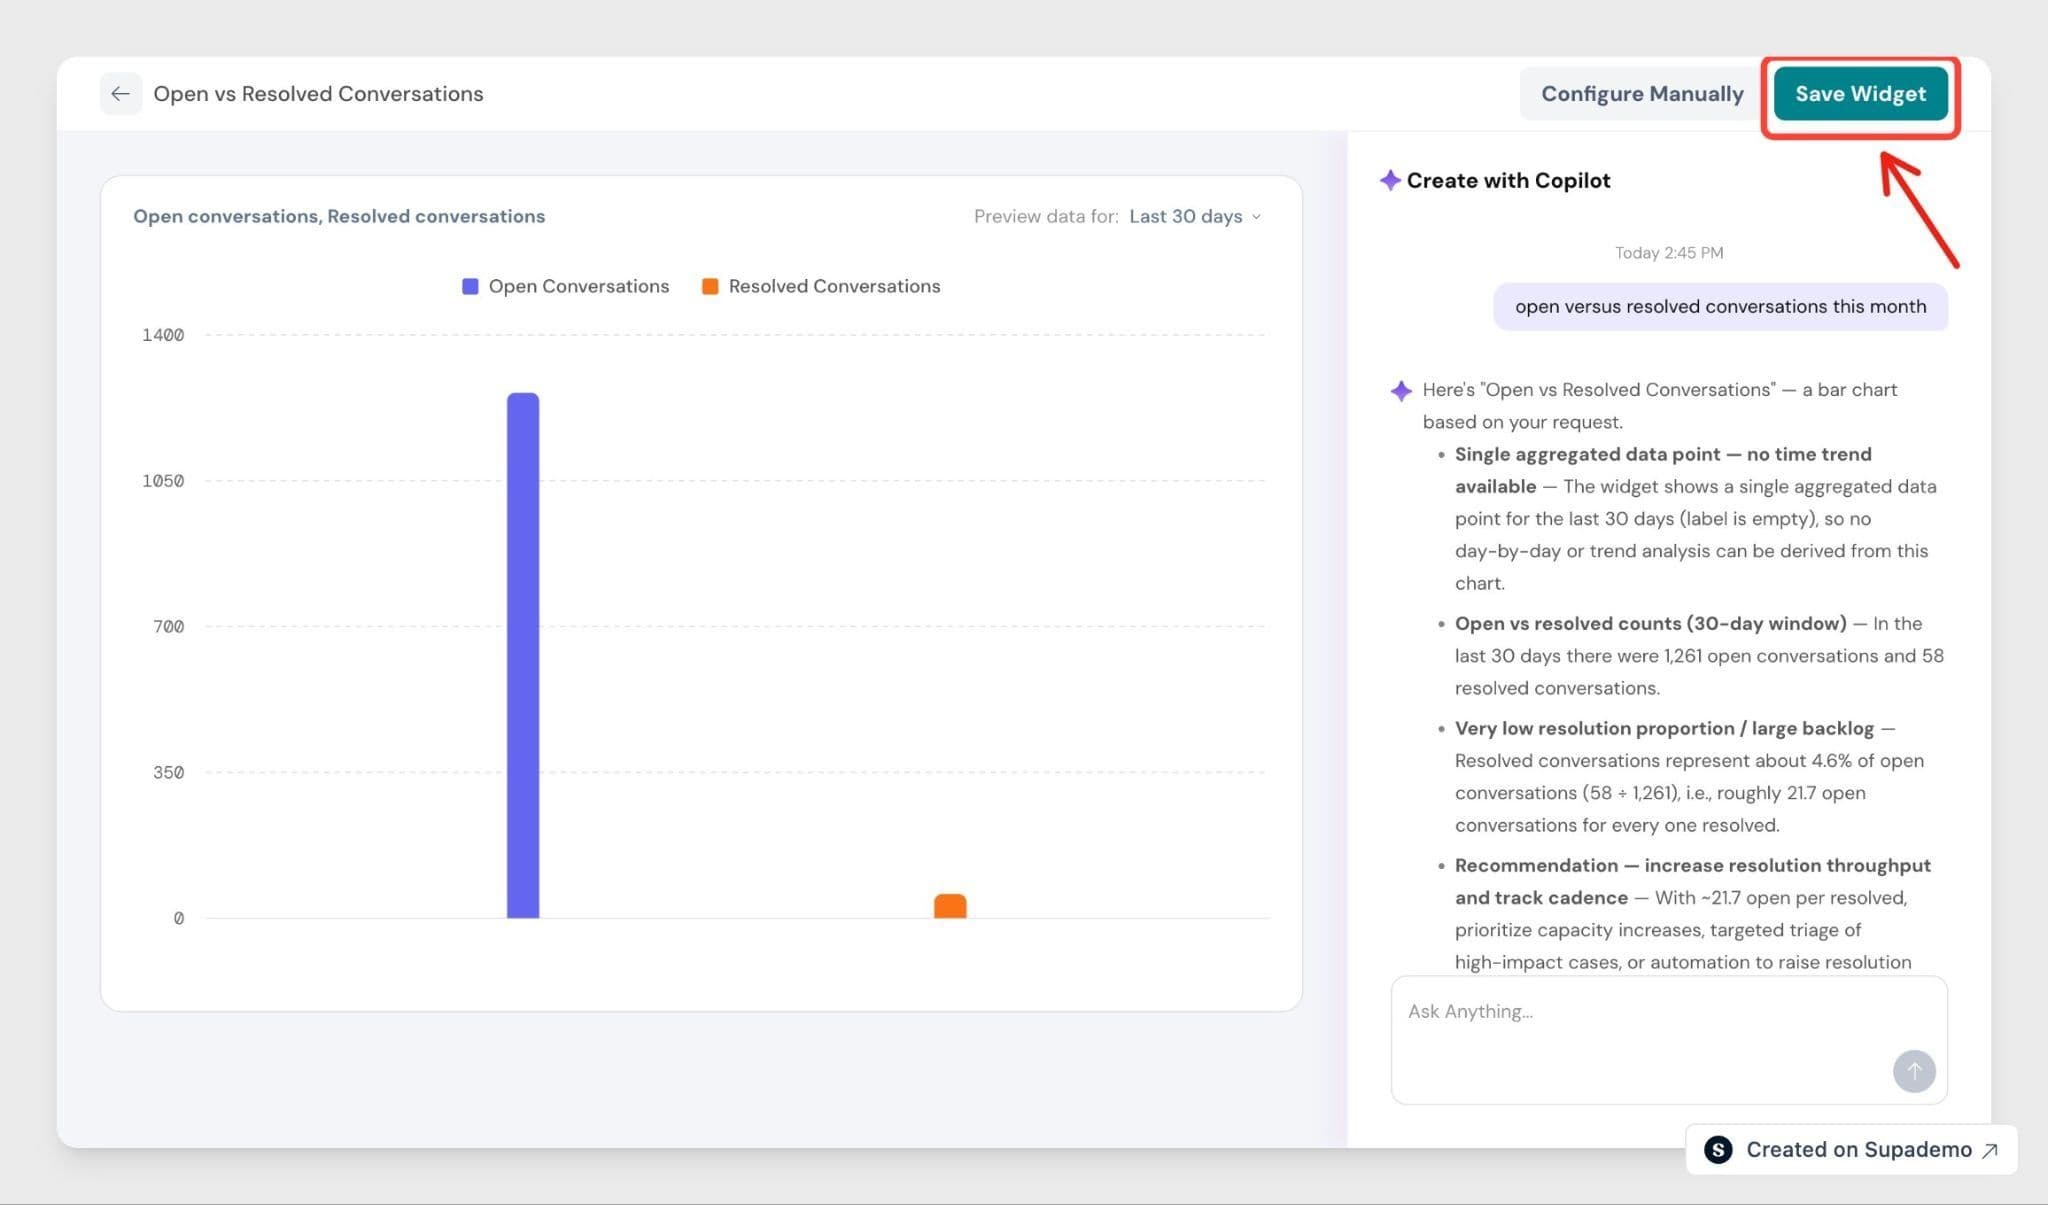
To change something, click Configure manually to open it in the builder and adjust it yourself, type another message to refine it, or ask SparrowDesk to try again.
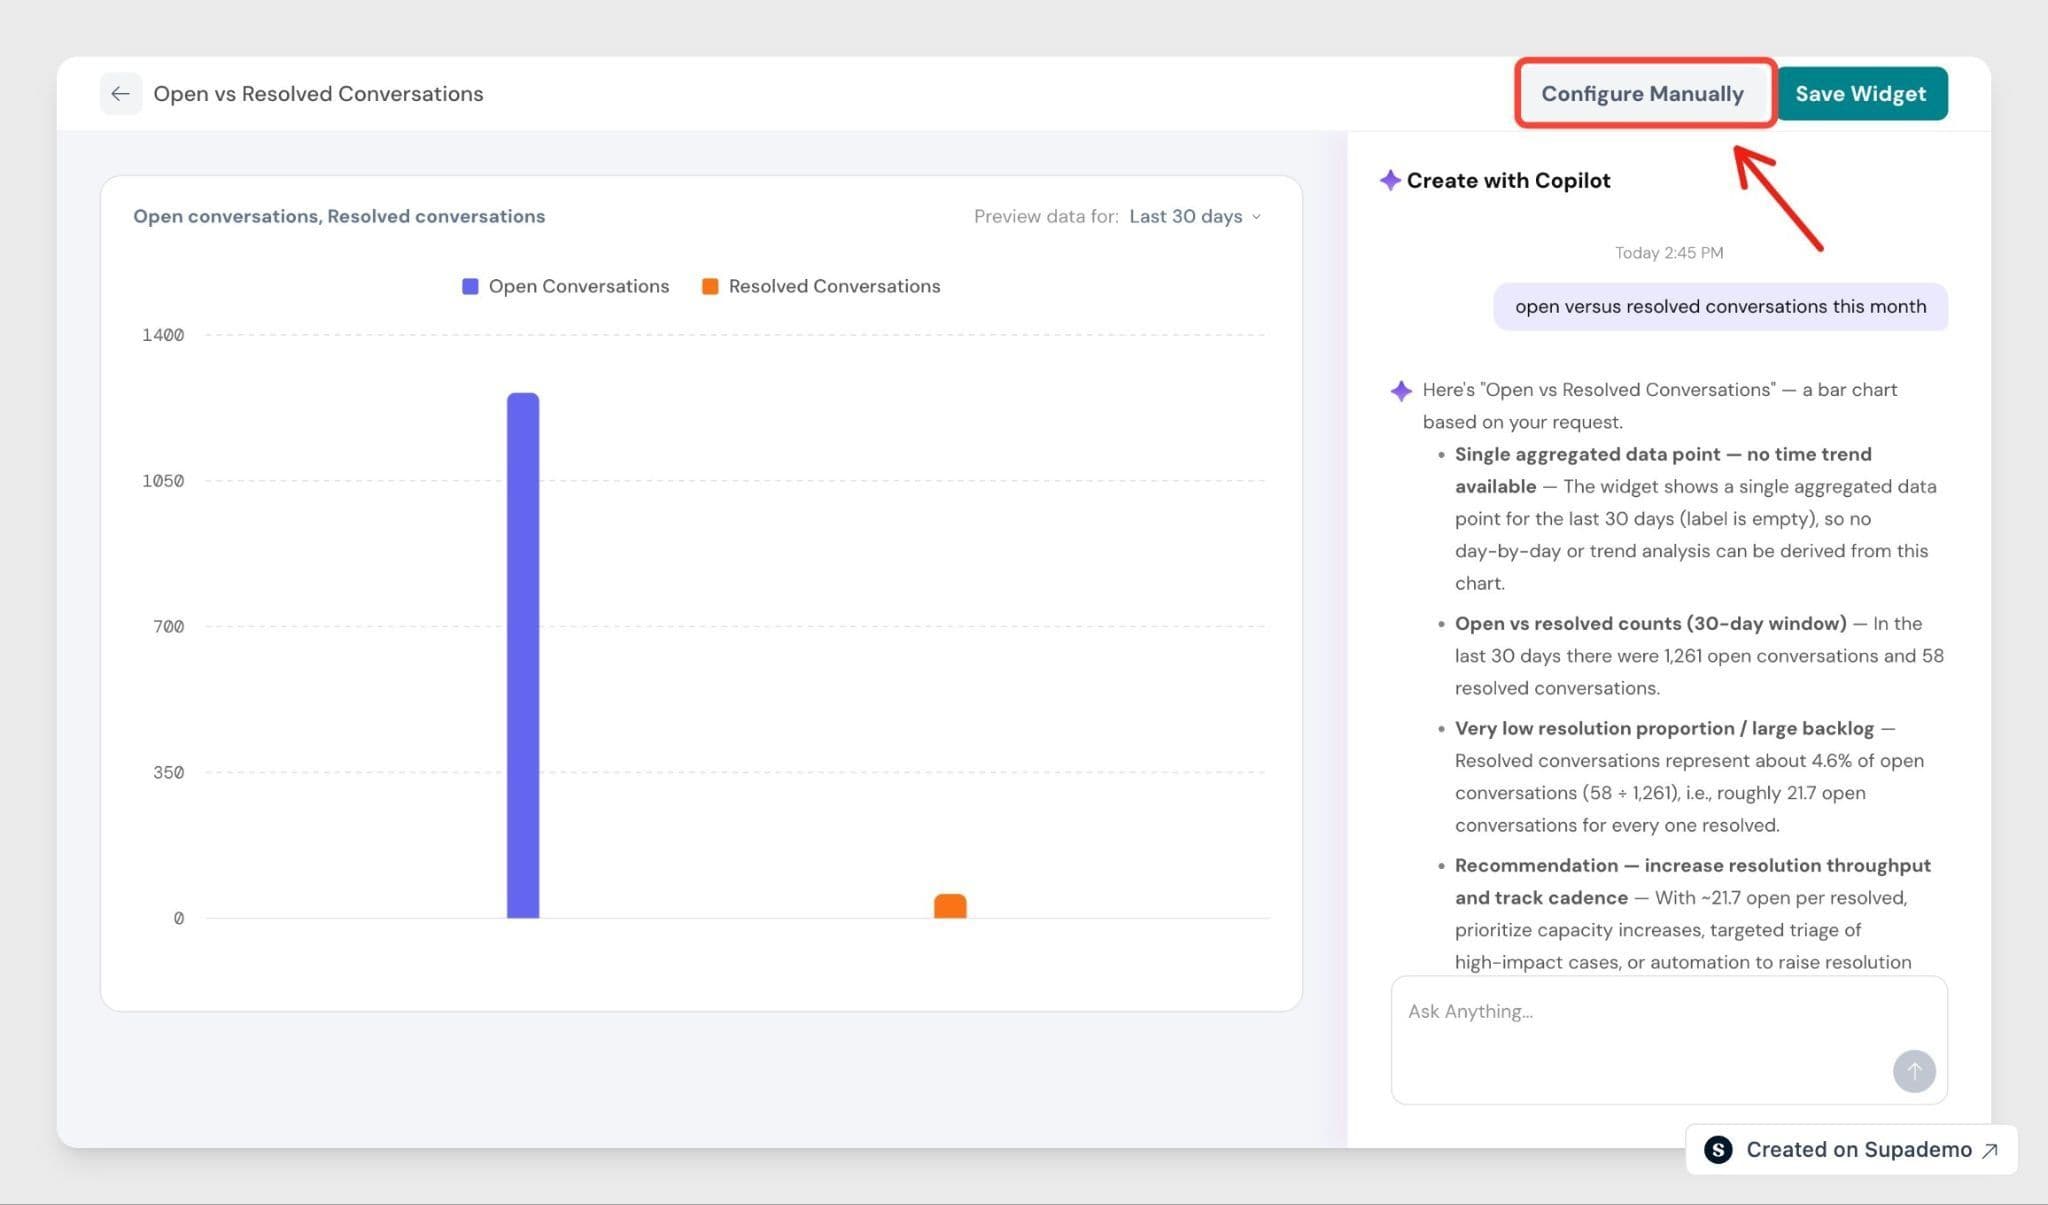
A widget you create with AI is no different from one you build by hand. You can save it, edit it, click into the conversations behind it, and download it like any other.
Build a widget
To build a widget yourself, click Add your first widget (or + Add Widget). The builder fills the screen, with a live preview on the left and the settings on the right.
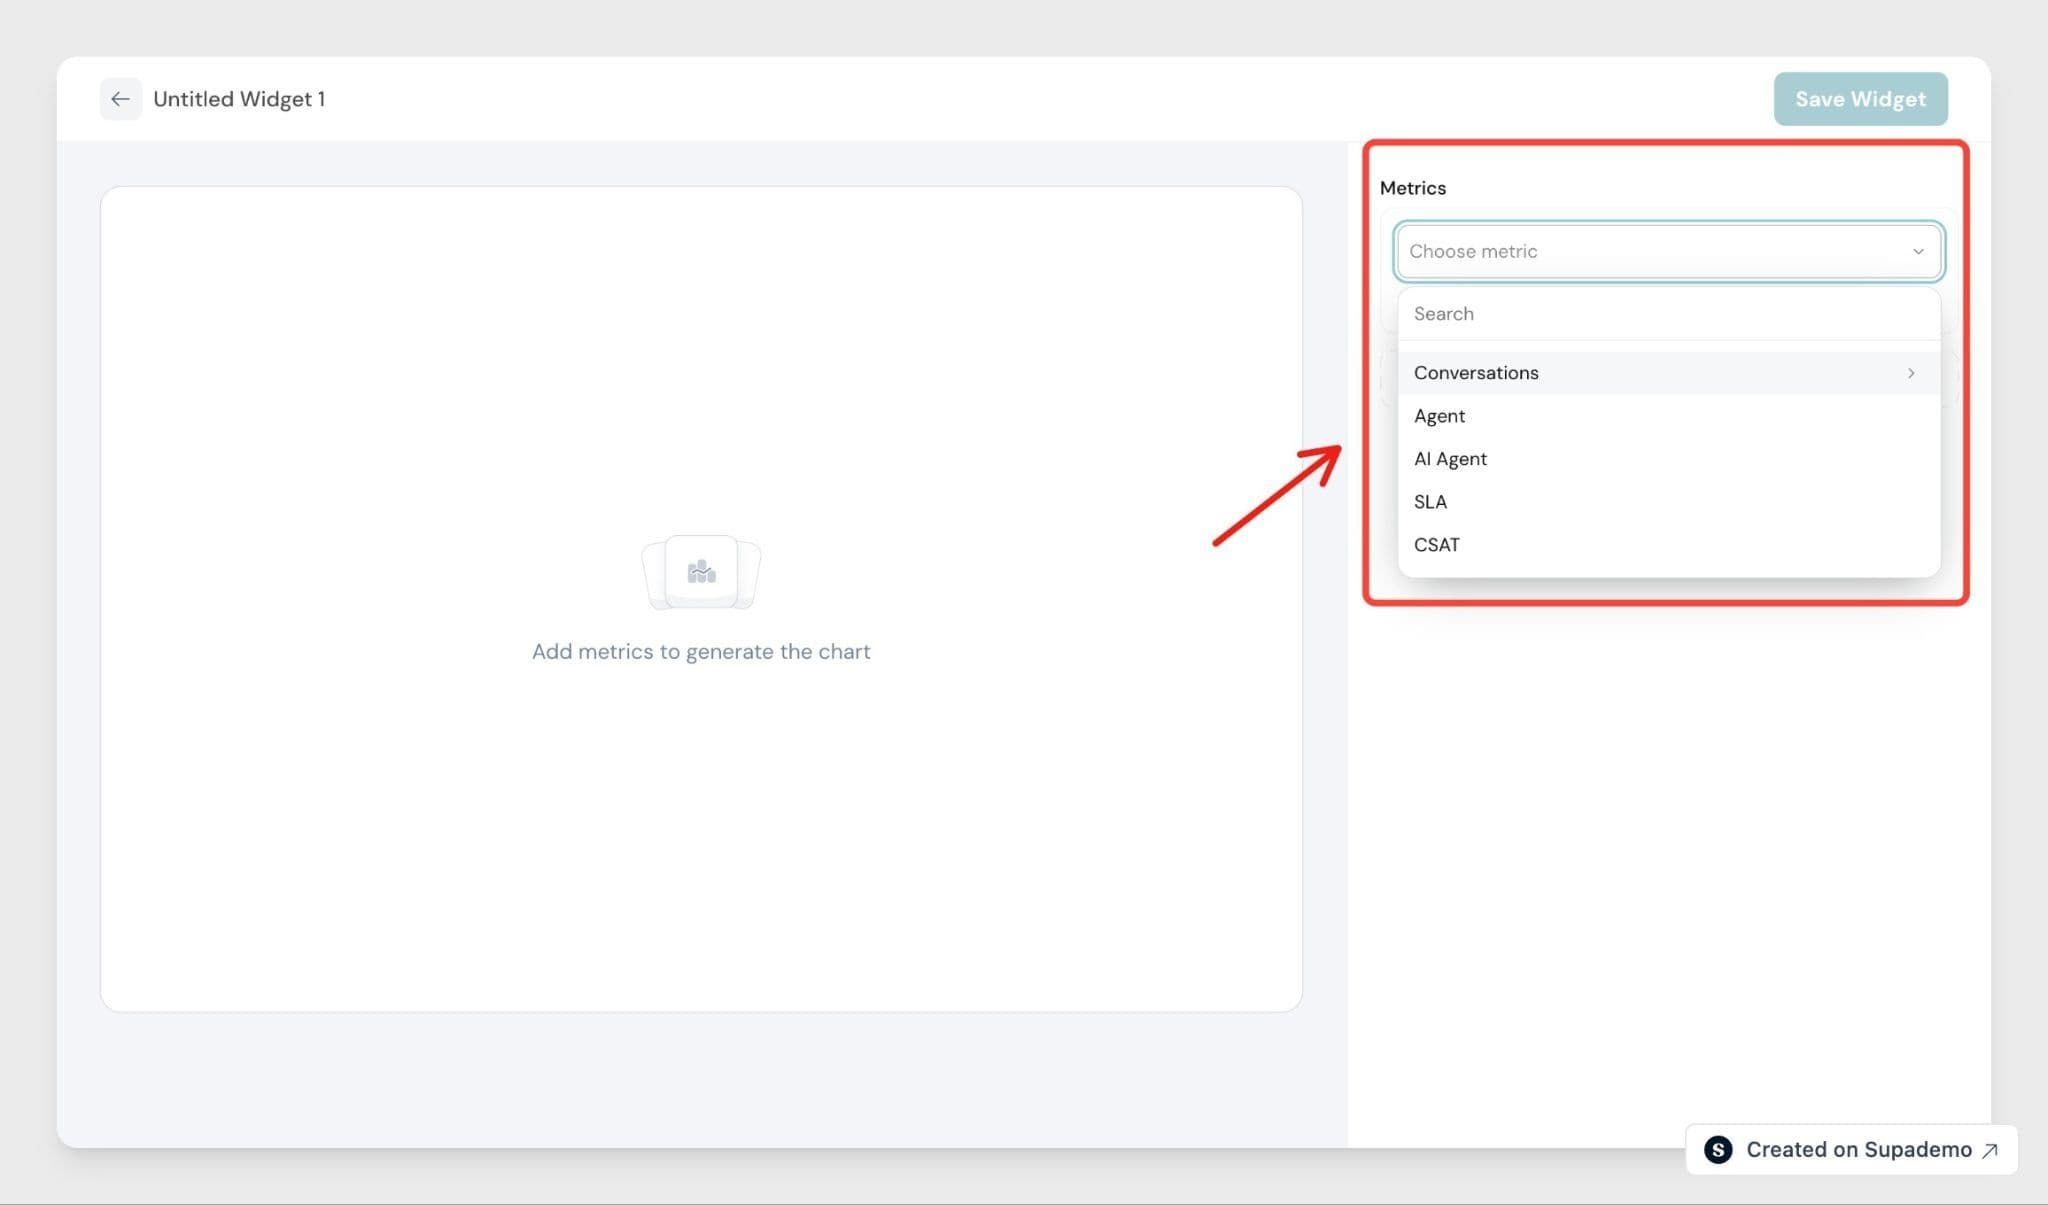
1. Choose what to measure
- Click to add a metric.
- Pick a set: Conversations, Agent, AI Agent, SLA, or CSAT.
- Choose a metric within that set, such as New conversations or Resolution time.
You can also search across every set at once. The preview updates as soon as you add a metric.
2. Set the aggregation
Each metric has a calculation that controls how its values are added up. Count and rate metrics use a fixed calculation. For time-based metrics like Resolution time, you can choose Average, Median, Min, Max, P90, or P95.
3. Filter a metric (optional)
Add a filter to narrow a metric to specific conversations, such as Channel is Email. You can add more than one condition and join them with AND or OR. A filter icon appears on the metric once a filter is set.
4. Add more metrics (optional)
Click + Add metric to track more than one value in the same widget. A widget can hold up to 20 metrics. Each metric keeps its own aggregation and filters.
5. Choose how to display it
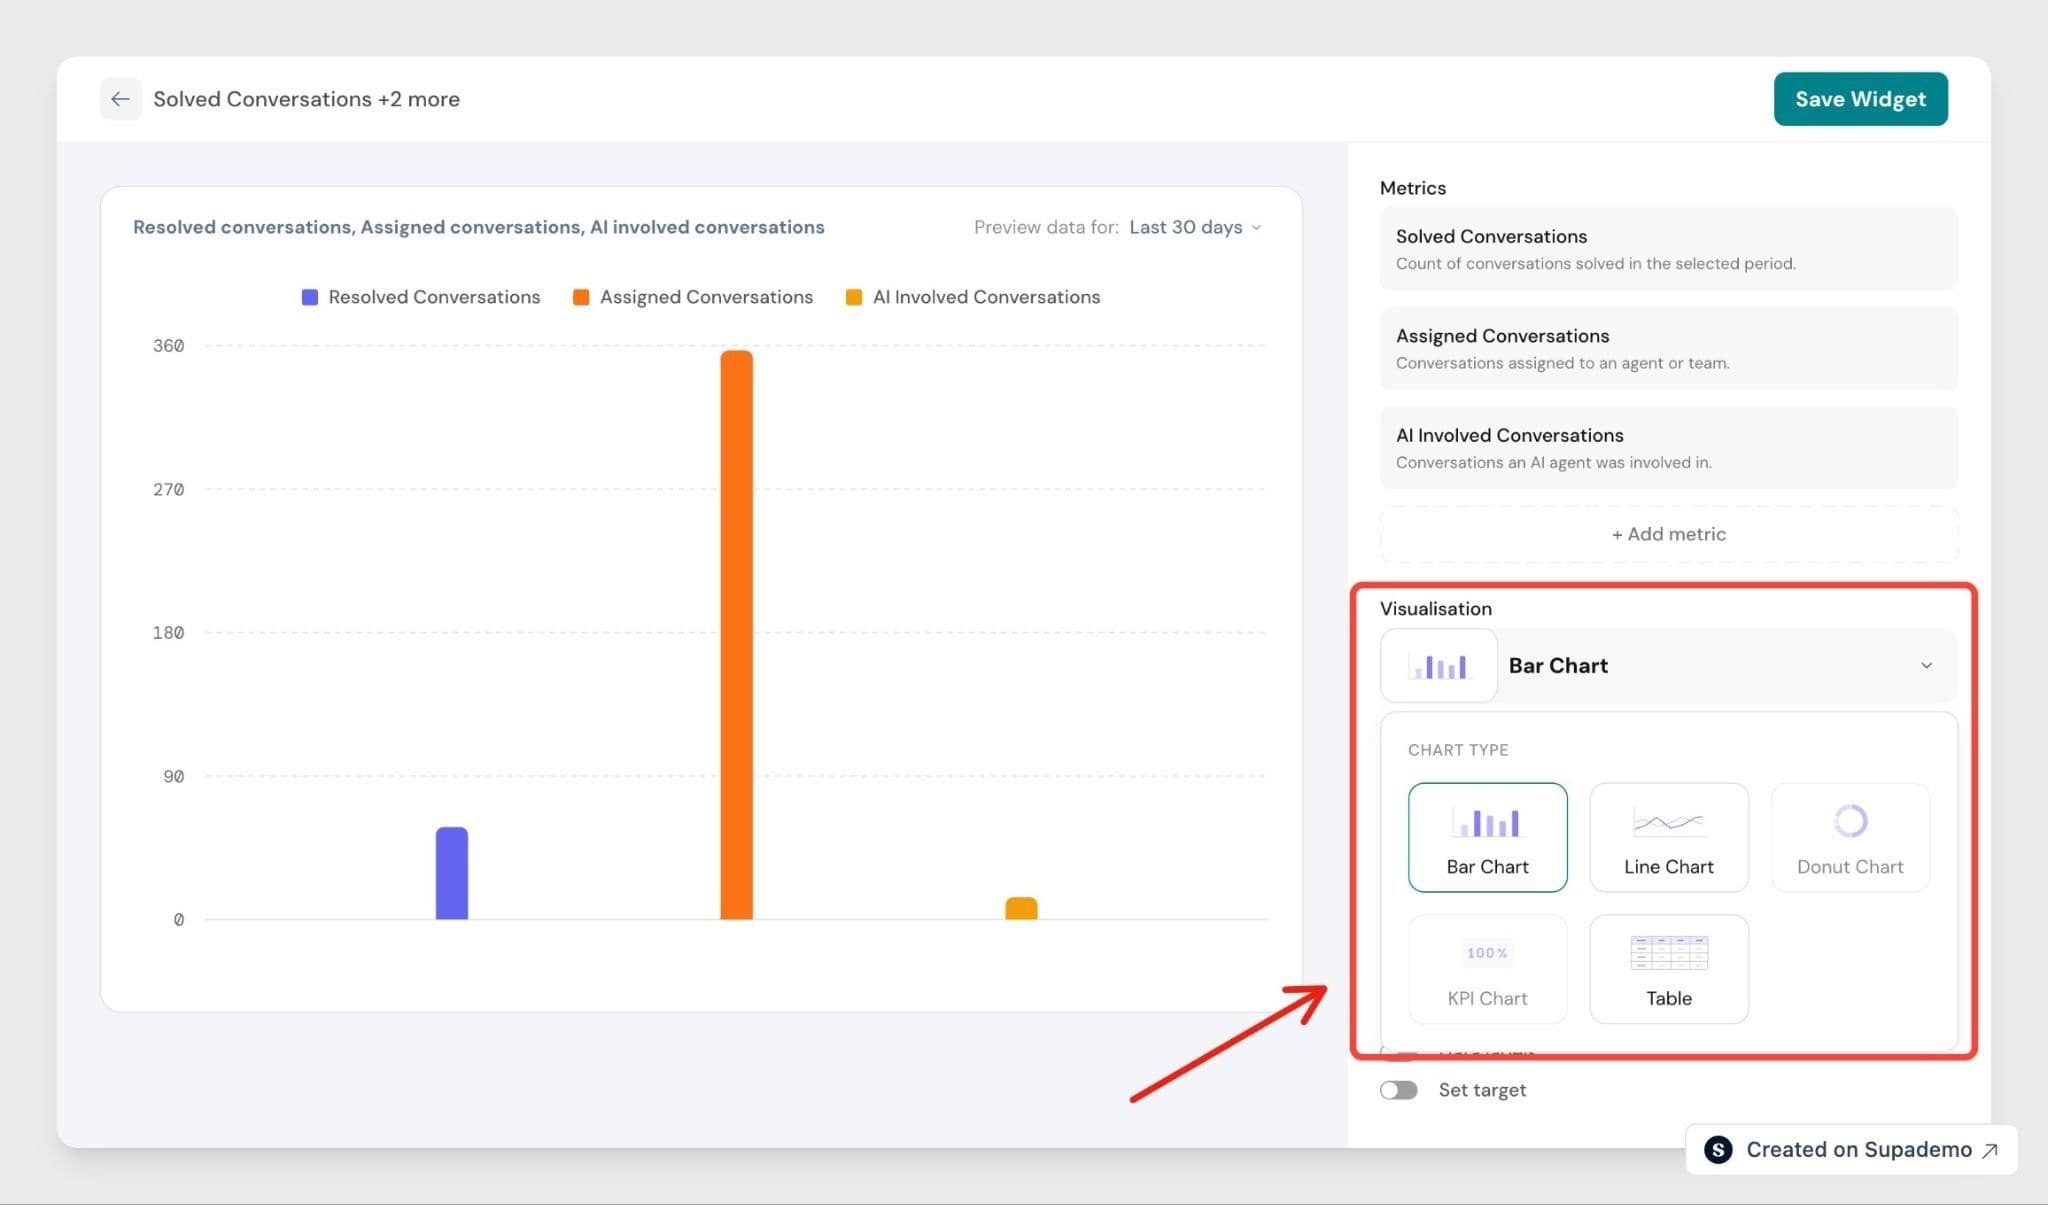
Pick a visualisation. Bar is selected by default once you add a metric. Here's what each one is best for:
- KPI: a single headline number, like this month's CSAT score.
- Bar: comparing groups side by side, like conversations by channel.
- Line: a trend over time, like resolutions per week.
- Donut: parts of a whole, like the share of conversations from each channel.
- Table: rows of detail, with one row per group and a column for each metric.
6. Break down the data
Once you've picked a chart, you can break the numbers down further.
- View by splits a metric into groups, such as conversations by channel, status, or date. It works on every chart except KPI.
- Segment by splits each of those groups again, such as each date by channel. It's available only on a Bar chart that shows a single metric.
A chart can show more than one series in two ways: by holding several metrics, or by using Segment by. It can't do both at once. A KPI shows a single number, so it has no breakdowns.
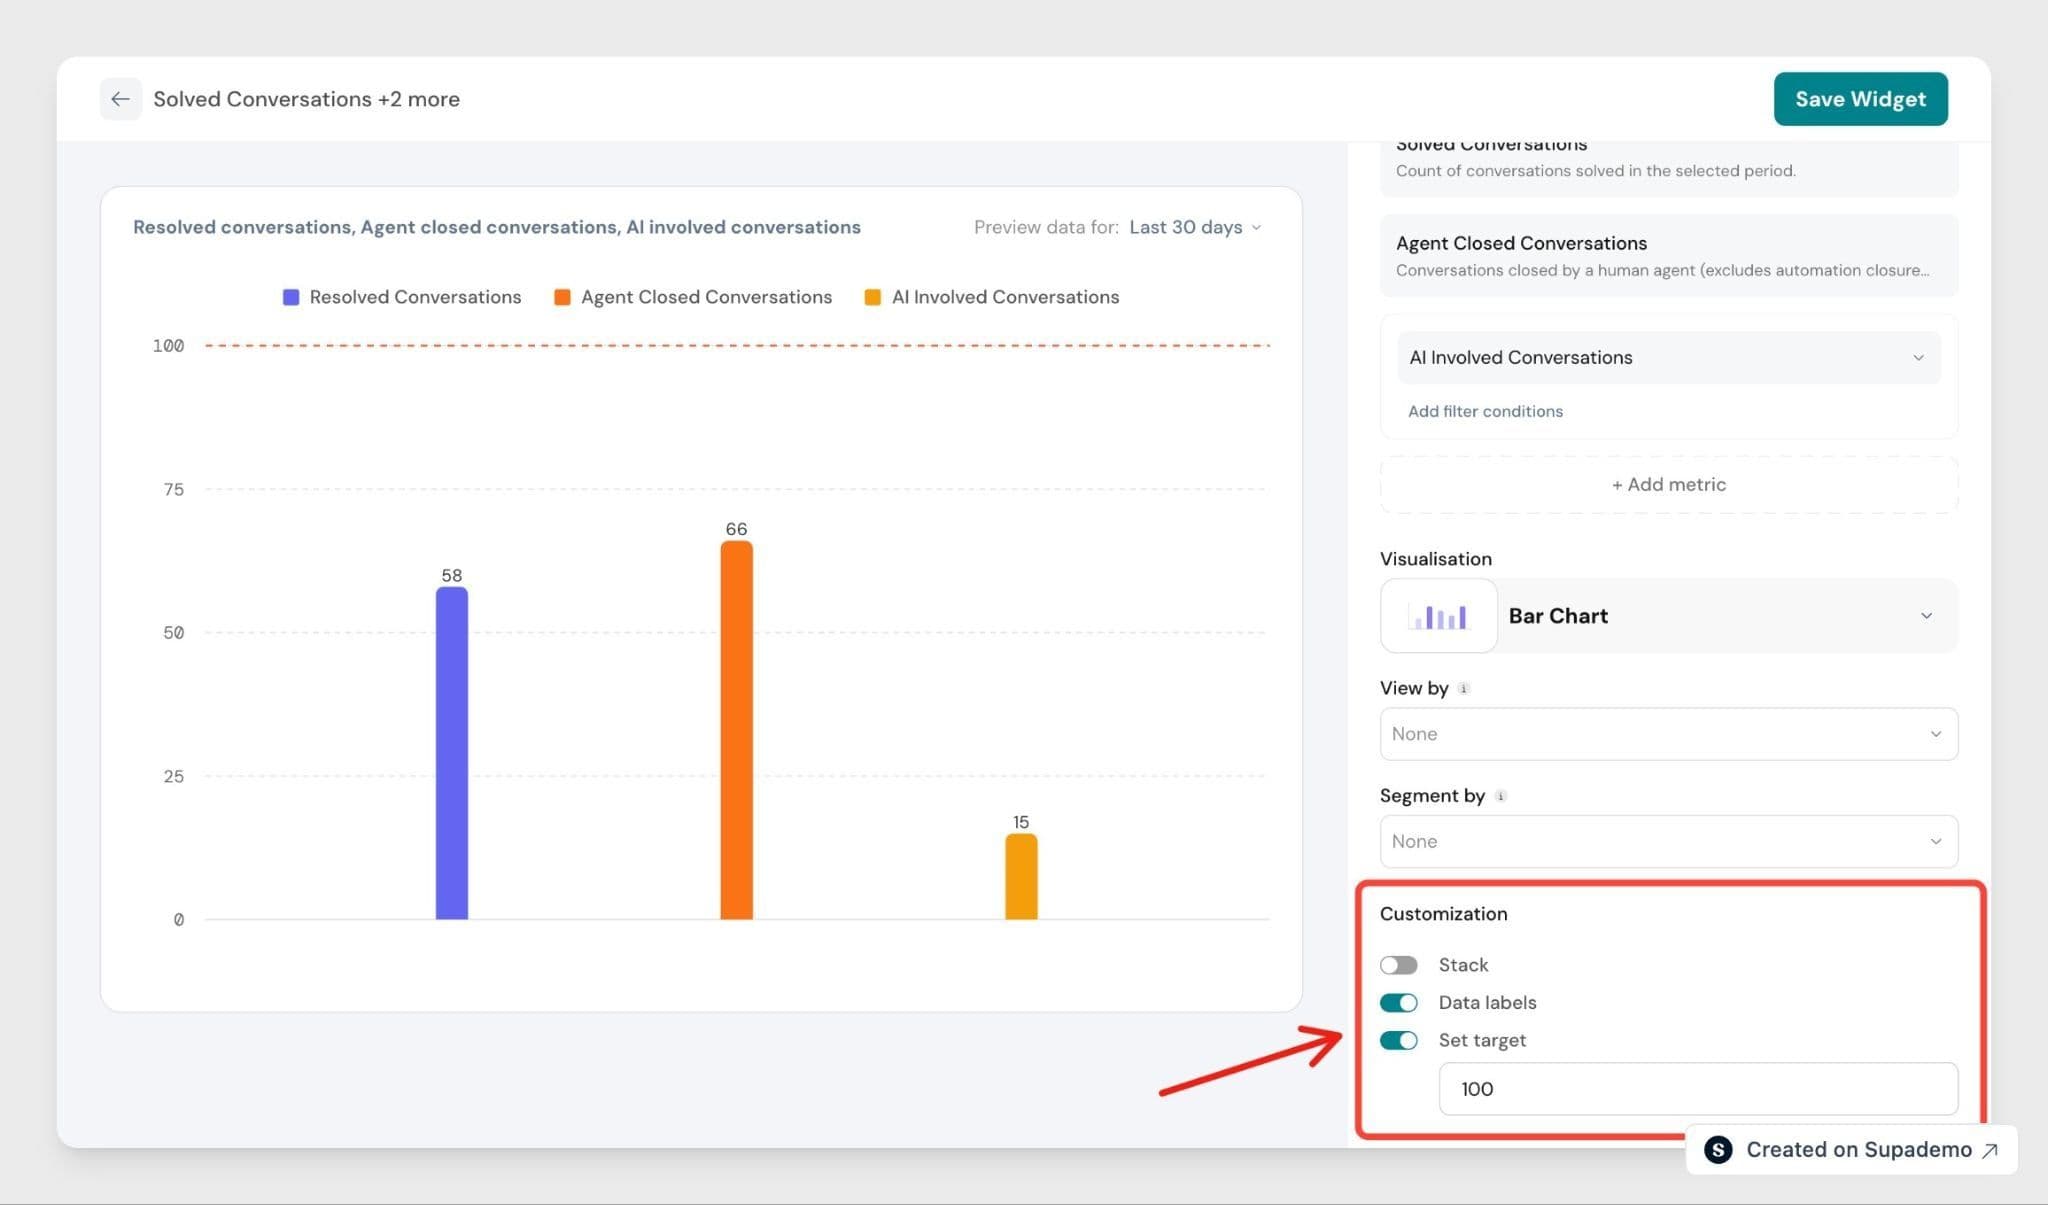
7. Customise the widget
The Customise tab shows options for the chart you picked:
- Data labels: show values directly on the chart, and set how they read — number format, decimal places, and whether to shorten large numbers (for example,
12kinstead of12,000). - Dual Y-axis: when a widget plots two metrics on different scales, give the second metric its own axis on the right so both stay readable in one chart.
- Set target: add a target line or highlight, so you can see whether you're hitting your goal.
- Stack: combine a segmented Bar chart's series into one bar.
- Compare to previous period: on a KPI, show the change against the period just before.
When the widget has at least one complete metric, click Save Widget.
Arrange and manage widgets
- Move: hover over a widget and drag it by the handle at the top.
- Resize: drag the handle at the bottom-right corner.
- Use the widget's overflow menu to Edit, Duplicate, or Delete it.
Report controls
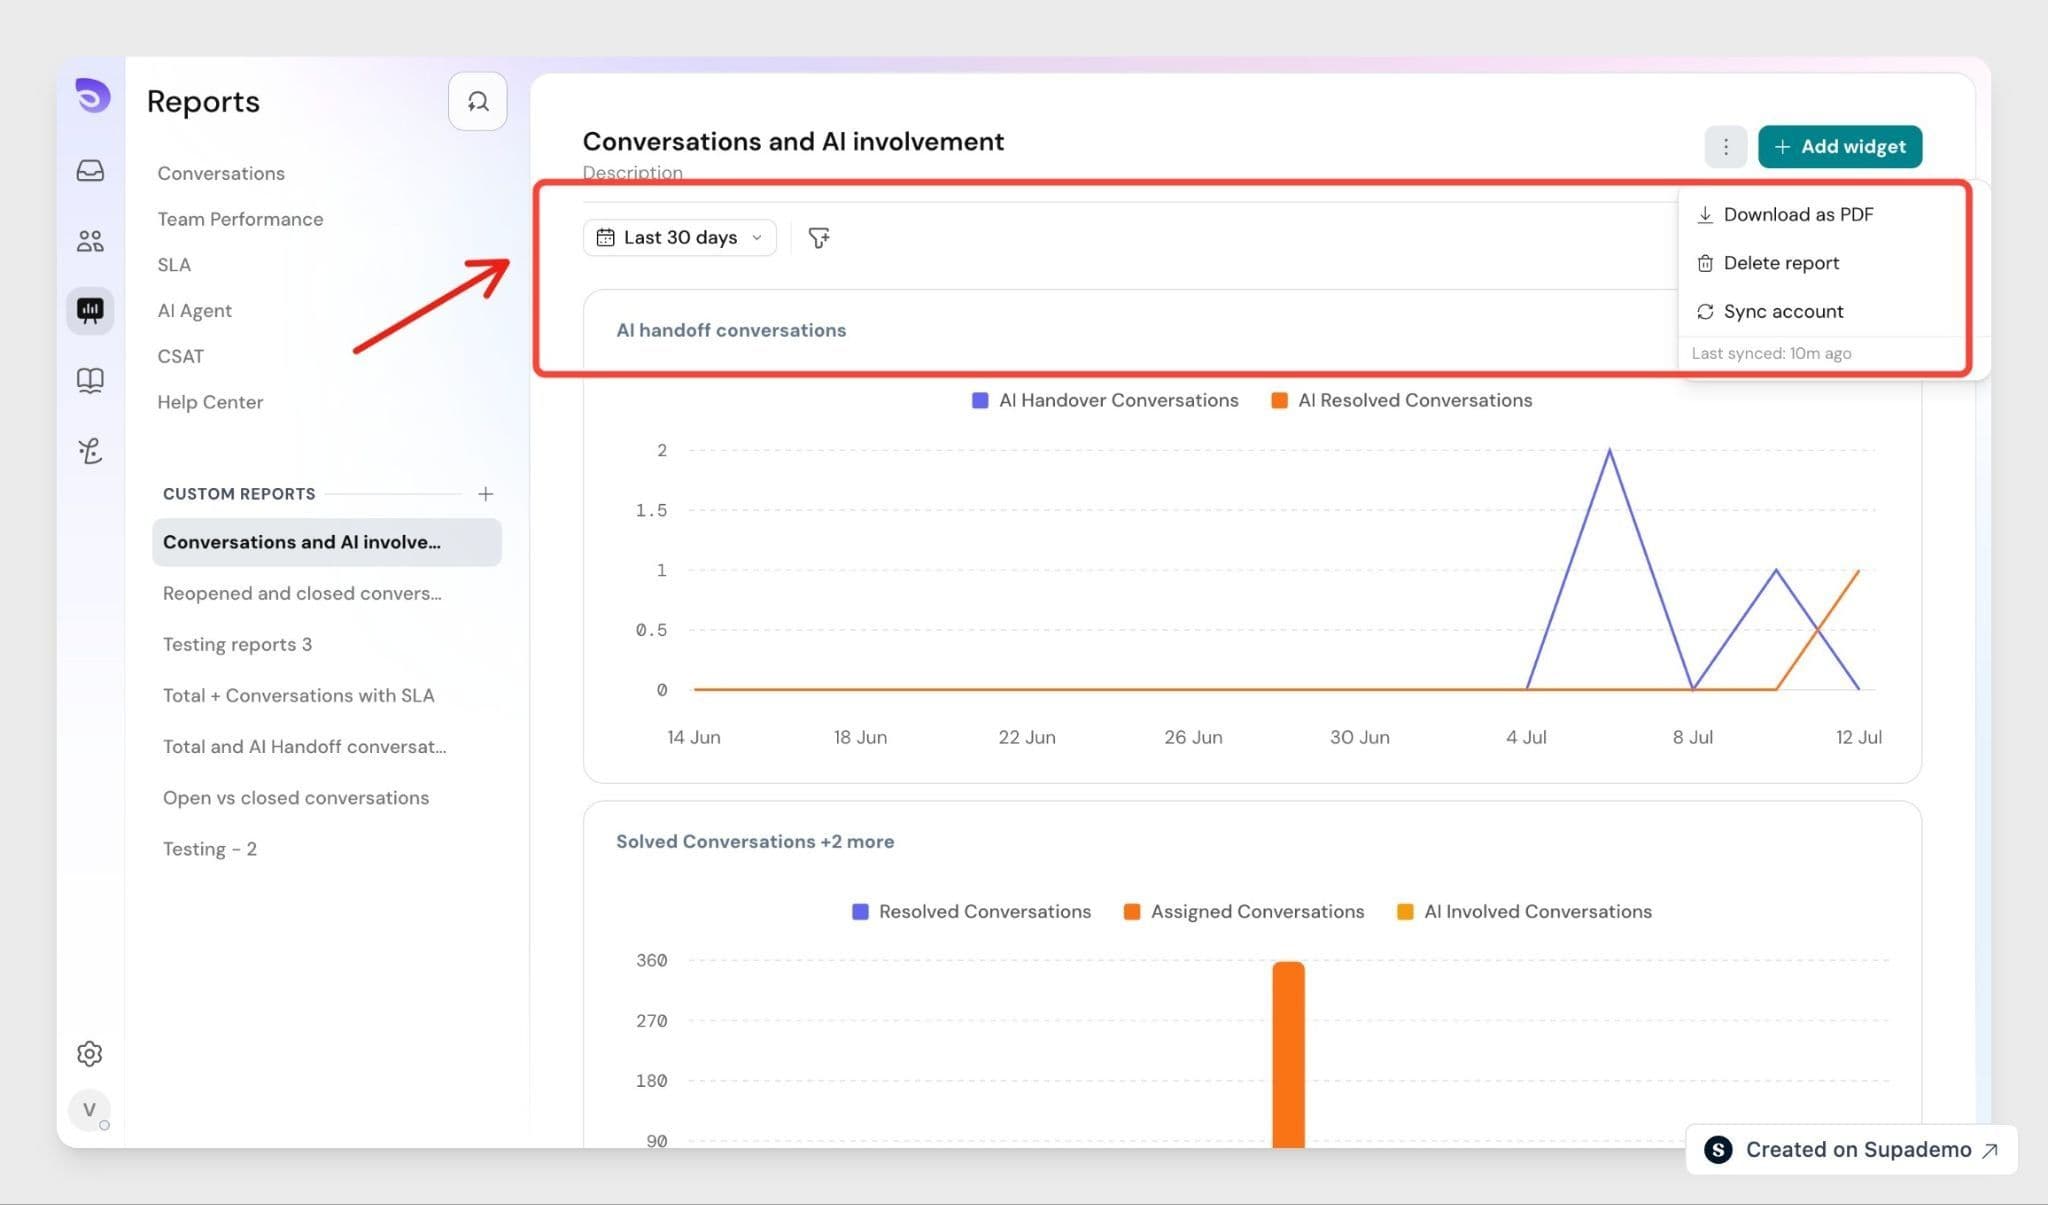
At the top of a report you can set the date range and apply a report filter that covers every widget at once. The overflow menu holds Download, which saves the report as a PDF, and Delete. Deleting a report asks you to confirm first.
The date range applies to the whole report, and every widget uses this same range.
Reports do not update in real time. SparrowDesk syncs the data in the background, which can take 30 minutes or longer, and the overflow menu shows when the report last synced. To update sooner, open the overflow menu and click Sync account for an immediate background sync.
See the conversations behind a chart
Click any number, bar, or slice in a saved widget to open the conversations behind it. This is the same drill-down you already use in default reports.
FAQ
- Can AI build a whole report for me?
No. AI creates one widget at a time. Add each widget you want, then arrange them in your report. To change an AI-built widget later, open it in the widget builder. - Can a widget use a different date range from the rest of the report?
No. Every widget follows the report's date range. The date selector inside the builder only changes the preview while you're building, not the saved widget. - Why can't I segment my chart?
Segmentation turns off when a widget has more than one metric, and it isn't available on Line, Donut, or Table charts. Use a single metric on a Bar chart to segment. - What's the difference between a metric filter and a report filter?
A metric filter narrows one metric inside a single widget. A report filter applies across every widget in the report at the same time. - Who can see the reports I build?
That depends on a person's Reports access. Anyone who can open a report can also download it, but only admins with the Manage reports permission can create or edit one.